Analysis of Software and Data Carpentry’s Pre- and Post-Workshop Surveys
Kari L. Jordan1
François Michonneau2
Belinda Weaver3
July 17th, 2018
Overview
Since November 17, 2015, Software and Data Carpentry have collected information on learner demographics, perception of tools, and confidence in working with data. As we continue in our goal to streamline processes as The Carpentries, the Assessment Team completed an analysis of the pre- and post-workshop surveys for both Software Carpentry and Data Carpentry. The goal of this analysis is to understand the impact our workshops are having on learners, and how we can improve our surveys and assessment infrastructure. This report covers the workshops from November 17, 2015 to May 21, 2018 for Software Carpentry, and from August 07, 2017 to May 11, 2018 for Data Carpentry.
As an overview, 1259 and 852 learners have responded to Data Carpentry’s pre- and post-workshop surveys respectively, while 14154 and 6458 have responded to Software Carpentry’s.
This report includes the following:
- Motivation for Attending Carpentries Workshops
- Workshop Type and Perception of Workshop Environment/Experience
- Effect of Workshops on Learners’ Self-Reported Perspectives, Skills, and Confidence
- Ability to Perform Computing Tasks
- Demographics
- Summary
Motivation for Attending Carpentries Workshops
Learners attend Carpentries workshops for many reasons. Data Carpentry’s workshops are domain-specific and focus on the fundamental data skills needed to conduct research. Data Carpentry’s Ecology and Social Sciences curricula begin with a lesson on data organization and include data cleaning with OpenRefine. From there, learners spend time learning a programming language, either Python or R, to manipulate and visualize data.
Data Carpentry’s Genomics curriculum focuses on best practices for organization of bioinformatics projects and data, use of command line utilities and tools to analyze sequence quality and perform variant calling, and connecting to and using cloud computing.
Why are learners participating in our workshops?
We are interested in knowing why learners attend our workshops. Respondents were asked to check all that apply for several factors provided in the tables below.
| Why learners attend Data Carpentry workshops? (n = 1245) | n | % |
|---|---|---|
| To learn skills that I can apply to my current work | 1058 | 85.0 |
| To learn skills that I can apply to my work in the future | 960 | 77.1 |
| To learn skills that will help me get a job | 445 | 35.7 |
| As a requirement for my program/current position | 103 | 8.3 |
| Other | 47 | 3.8 |
85% of Data Carpentry learners attend workshops to learn skills they can apply to their current work.
Software Carpentry’s curriculum teaches basic lab skills for scientific computing. Their workshops include automation with the Unix shell, version control with Git, and programming with R or Python. These tools help learners to increase the efficiency and reproducibility of their computational work.
| Why learners attend Software Carpentry Workshops? (n = 630) | n | % |
|---|---|---|
| To cover new/additional topics | 457 | 72.5 |
| To refresh/review skills | 339 | 53.8 |
| To network | 78 | 12.4 |
| To become a Software Carpentry helper/instructor | 39 | 6.2 |
| To help host/run a workshop | 37 | 5.9 |
| Other | 31 | 4.9 |
| Software Carpentry 1st Time Learners | n | % |
|---|---|---|
| Yes | 11495 | 81.2 |
| Didn’t answer | 1963 | 13.9 |
| No | 696 | 4.9 |
Compared to Data Carpentry’s learners, Software Carpentry’s tend to have more experience with the tools covered in the workshops, and learners come to learn new and/or additional topics (72.5%). It is also interesting to note that 81.2% of Software Carpentry respondents are first-time attendees.
What is the current level of satisfaction of the data management practices of our learners before attending our workshops?
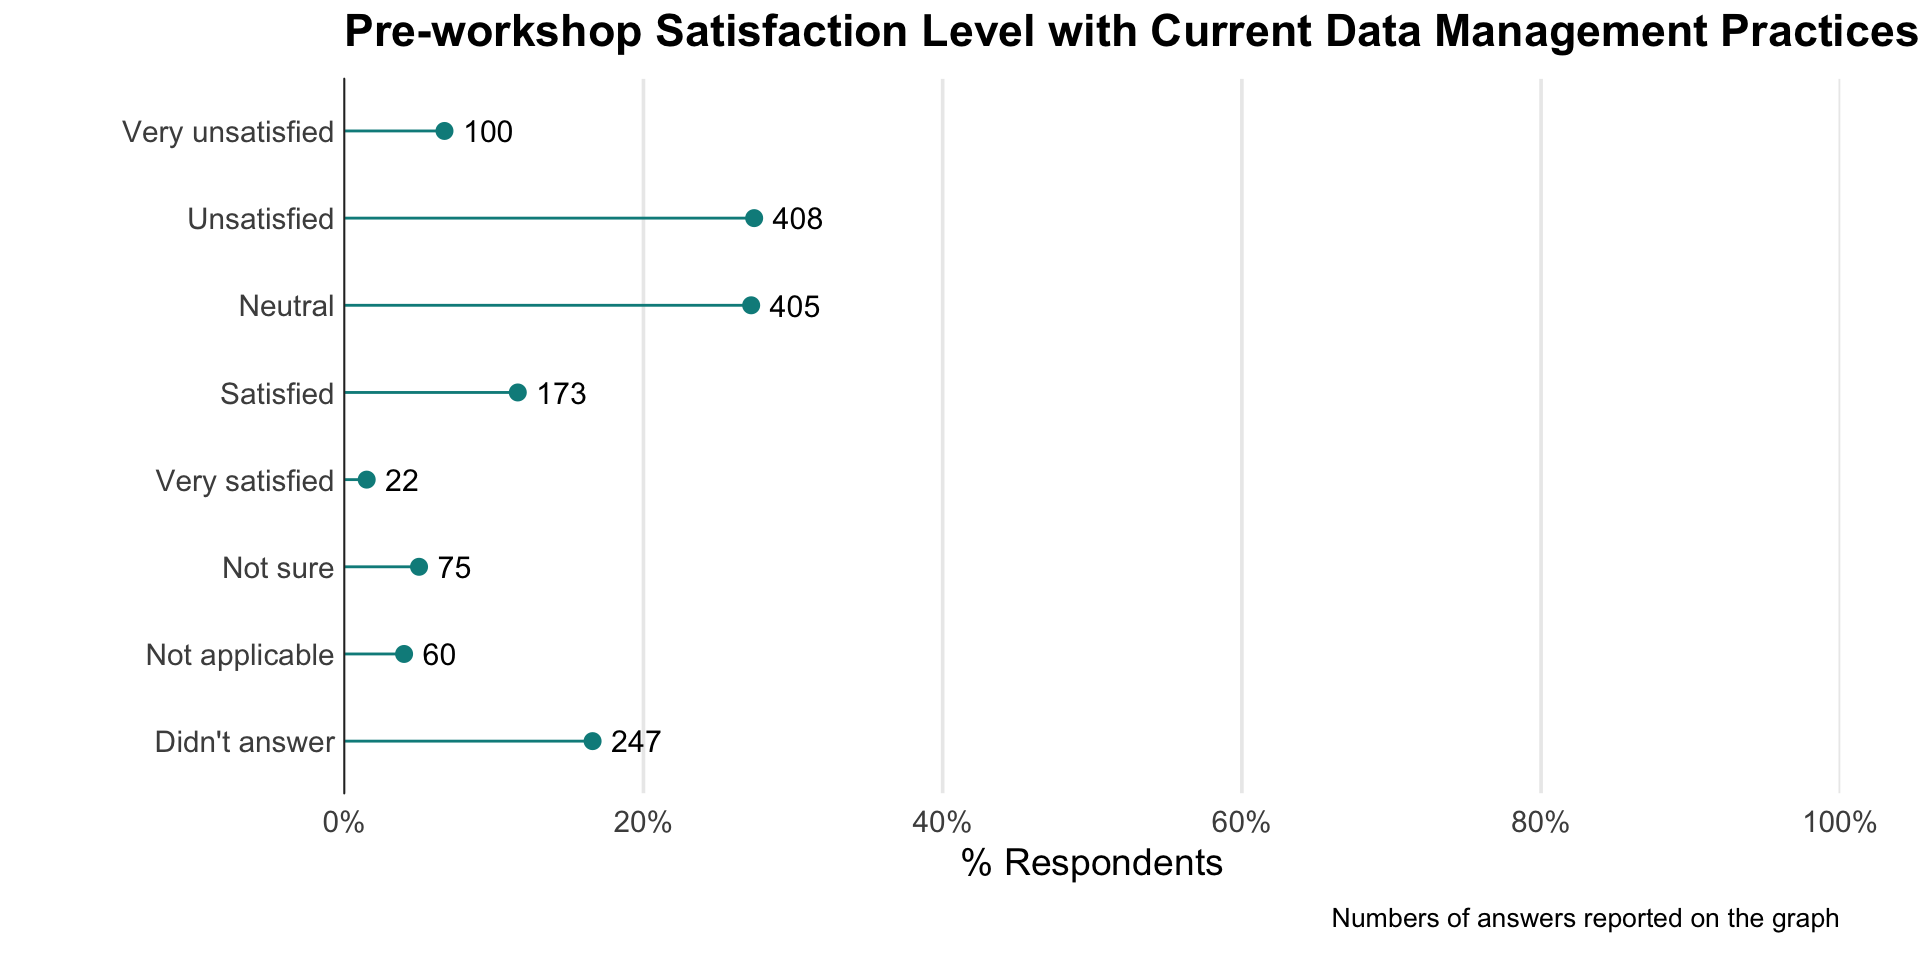
The majority (72.5%) of Data Carpentry’s respondents are either unsatisfied or feel neutral with their current data management practices. By data management practices, we include behaviors such as keeping your raw data raw, reusing code, and using databases, queries, and scripts to manage large data sets.
How often do our workshop participants program before attending our workshops?
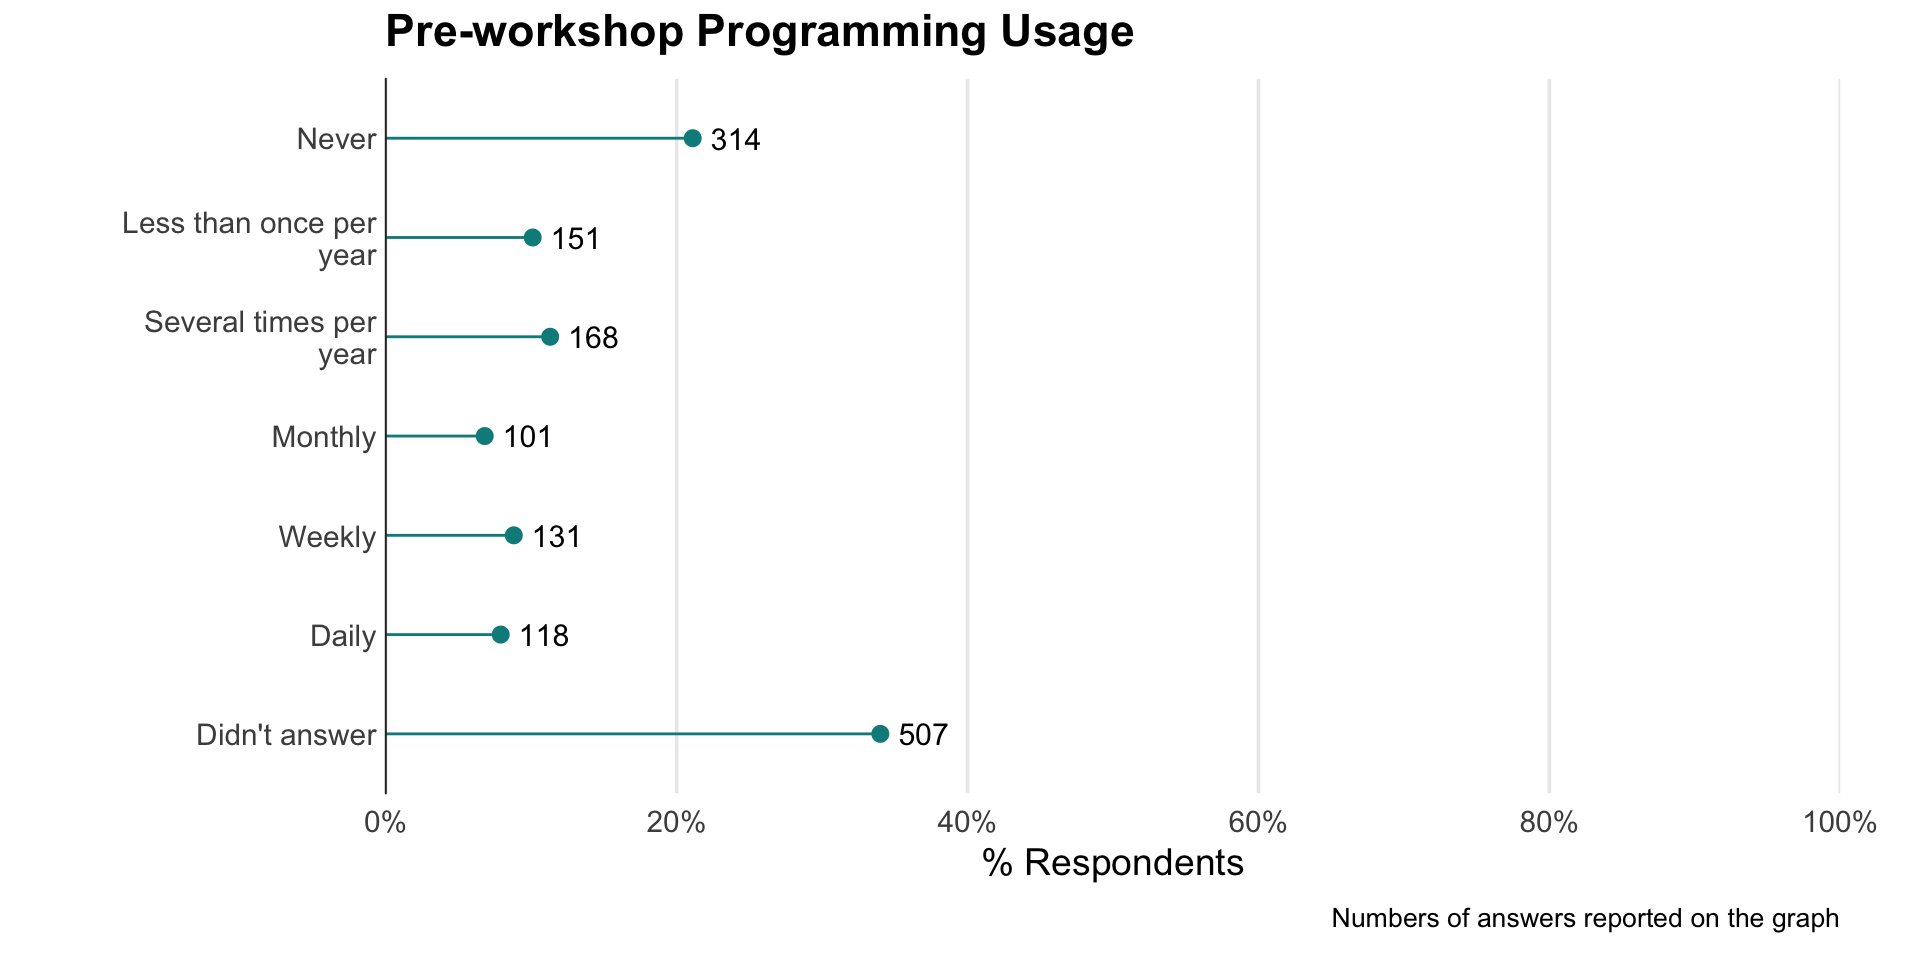
In terms of current programming usage, 36.9% of learners either never use programming, use programming less than once per year, or no more than several times per year. Only 9.4% program on a daily basis. This is no surprise, as Data Carpentry workshops are intended for novices.
| How respondents find out about Data Carpentry workshops (n =1243) | n | % |
|---|---|---|
| Received an email about the workshop | 802 | 64.5 |
| My friend/colleague told me about it | 324 | 26.1 |
| My advisor/supervisor told me about it | 244 | 19.6 |
| Read about it in a newsletter or university web site | 85 | 6.8 |
| Other | 49 | 3.9 |
| Other web site | 20 | 1.6 |
| Twitter or other social media | 17 | 1.4 |
| How respondents find out about Software Carpentry workshops (n = 10677) | n | % |
|---|---|---|
| Institution mailing list or flyer | 5143 | 48.2 |
| Friend/colleague | 4810 | 45.1 |
| Other | 758 | 7.1 |
| Conference/meeting/seminar | 637 | 6.0 |
| Our website | 356 | 3.3 |
| Funding organization or program officer | 355 | 3.3 |
| Social Media (Twitter, Facebook, etc.) | 293 | 2.7 |
| Journal or publication | 37 | 0.3 |
Data Carpentry and Software Carpentry workshop participants often find out about our workshops through institutional mailing lists (64.5% and 48.2% respectively). However, “word-of-mouth” recommendations also play a significant role in populating workshops.
In summary, both Data and Software Carpentry workshop respondents attend workshops to learn about or improve upon their current data management and analysis skills.
Workshop Type
| Data Carpentry: Language Covered in Workshops | n | % |
|---|---|---|
| R | 614 | 72.1 |
| Python | 118 | 13.8 |
| Didn’t answer | 58 | 6.8 |
| Neither | 57 | 6.7 |
| I don’t know./I don’t remember. | 5 | 0.6 |
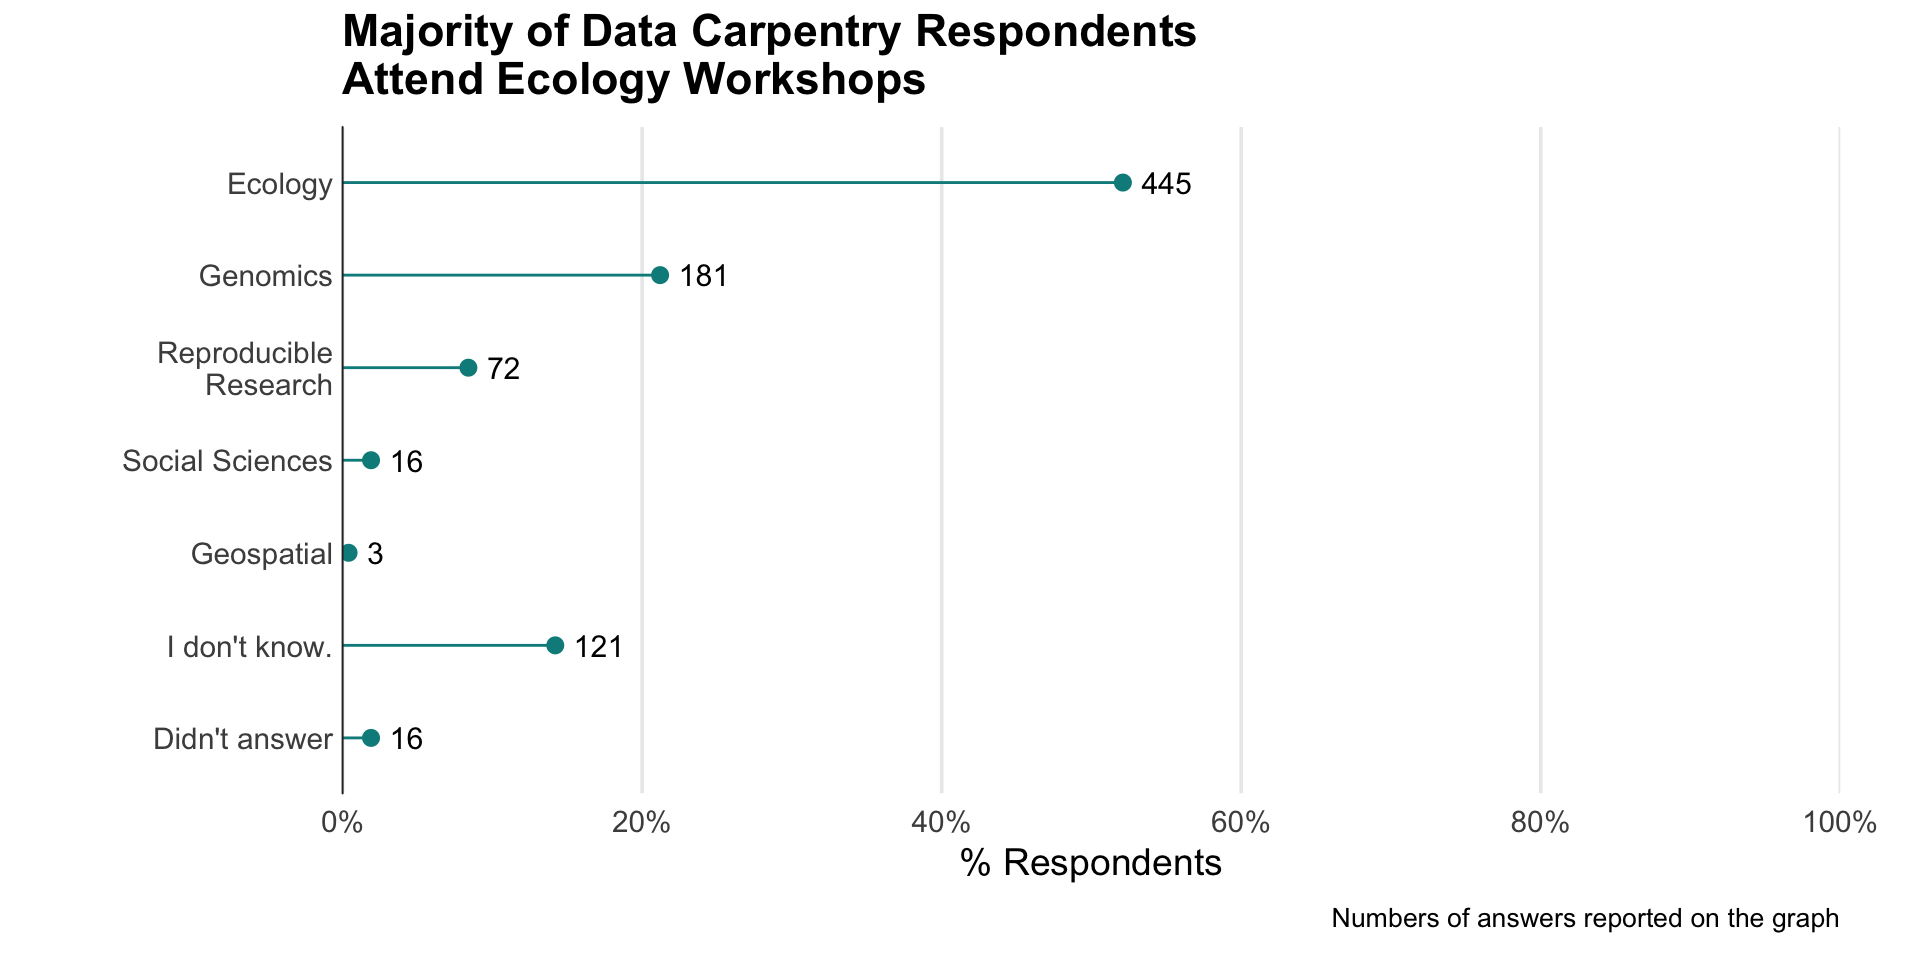
As previously mentioned, Data Carpentry workshops are domain-specific, and curricula include Ecology, Genomics, Geospatial, Social Sciences, and Reproducible Research. 72.1% of respondents learned R in their workshop, while 13.8% learned Python.
Perception of Workshop Environment and Experience
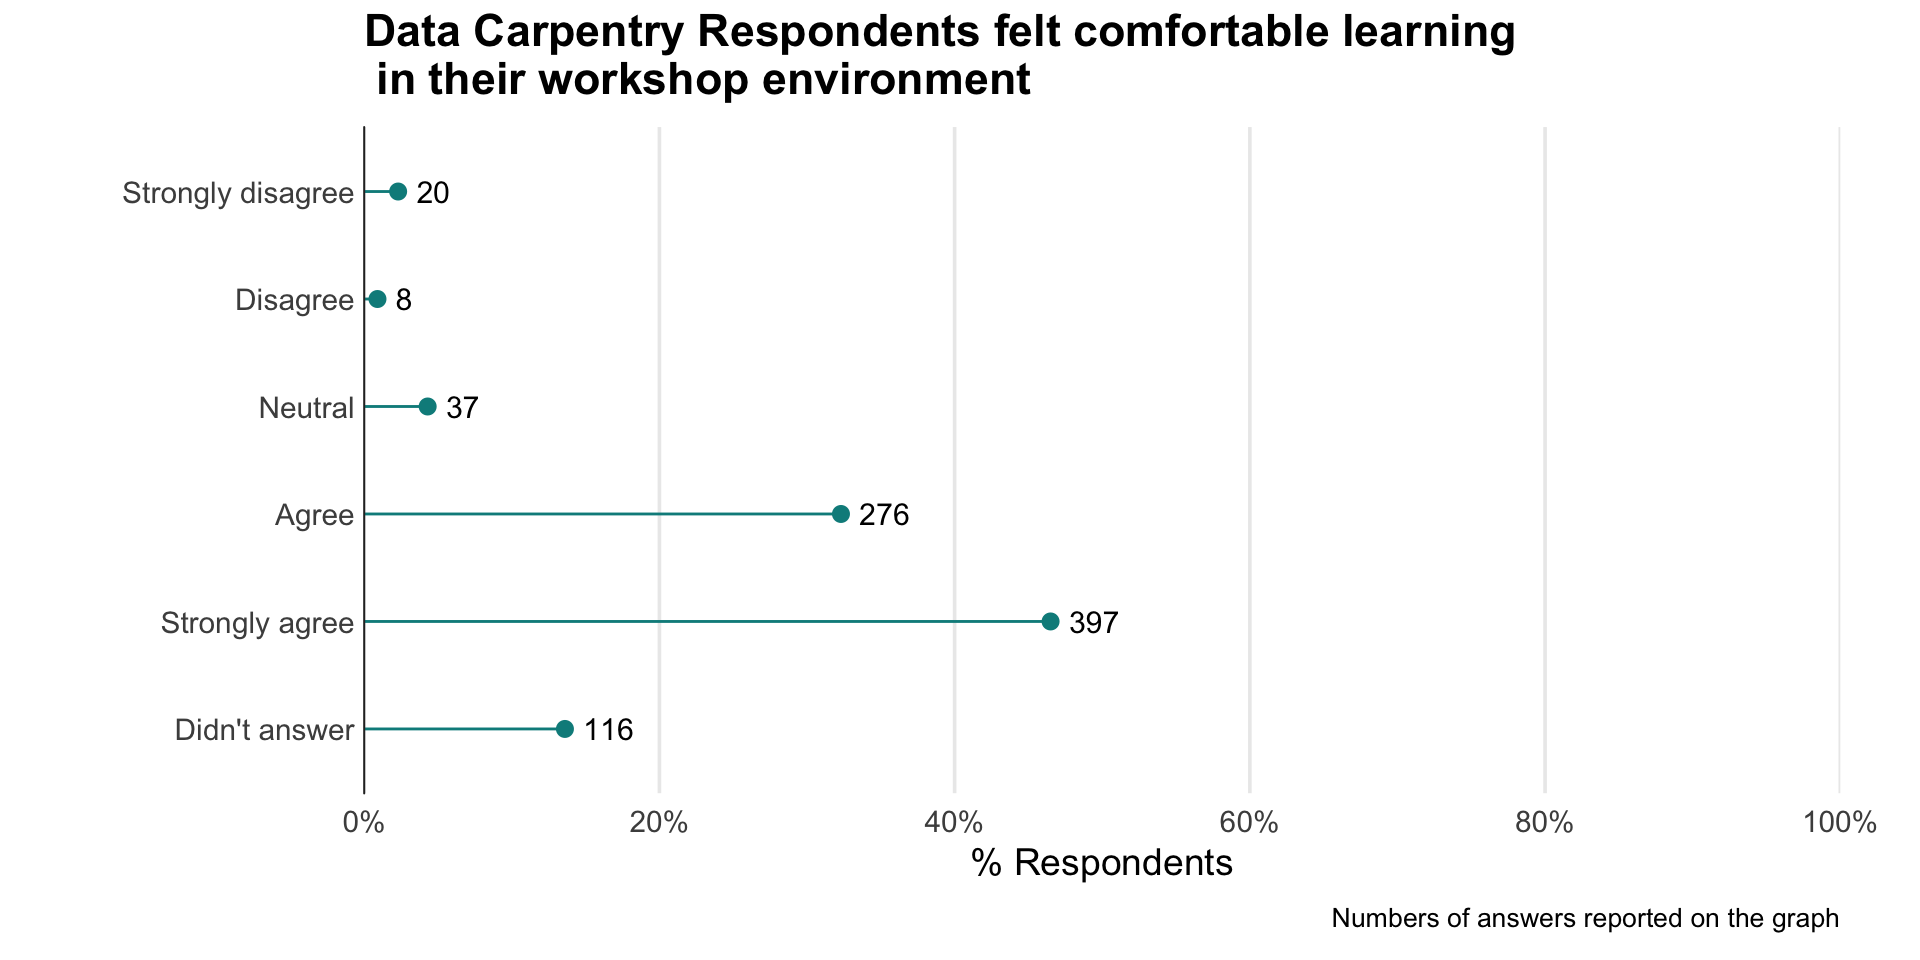
Comfort of the environment
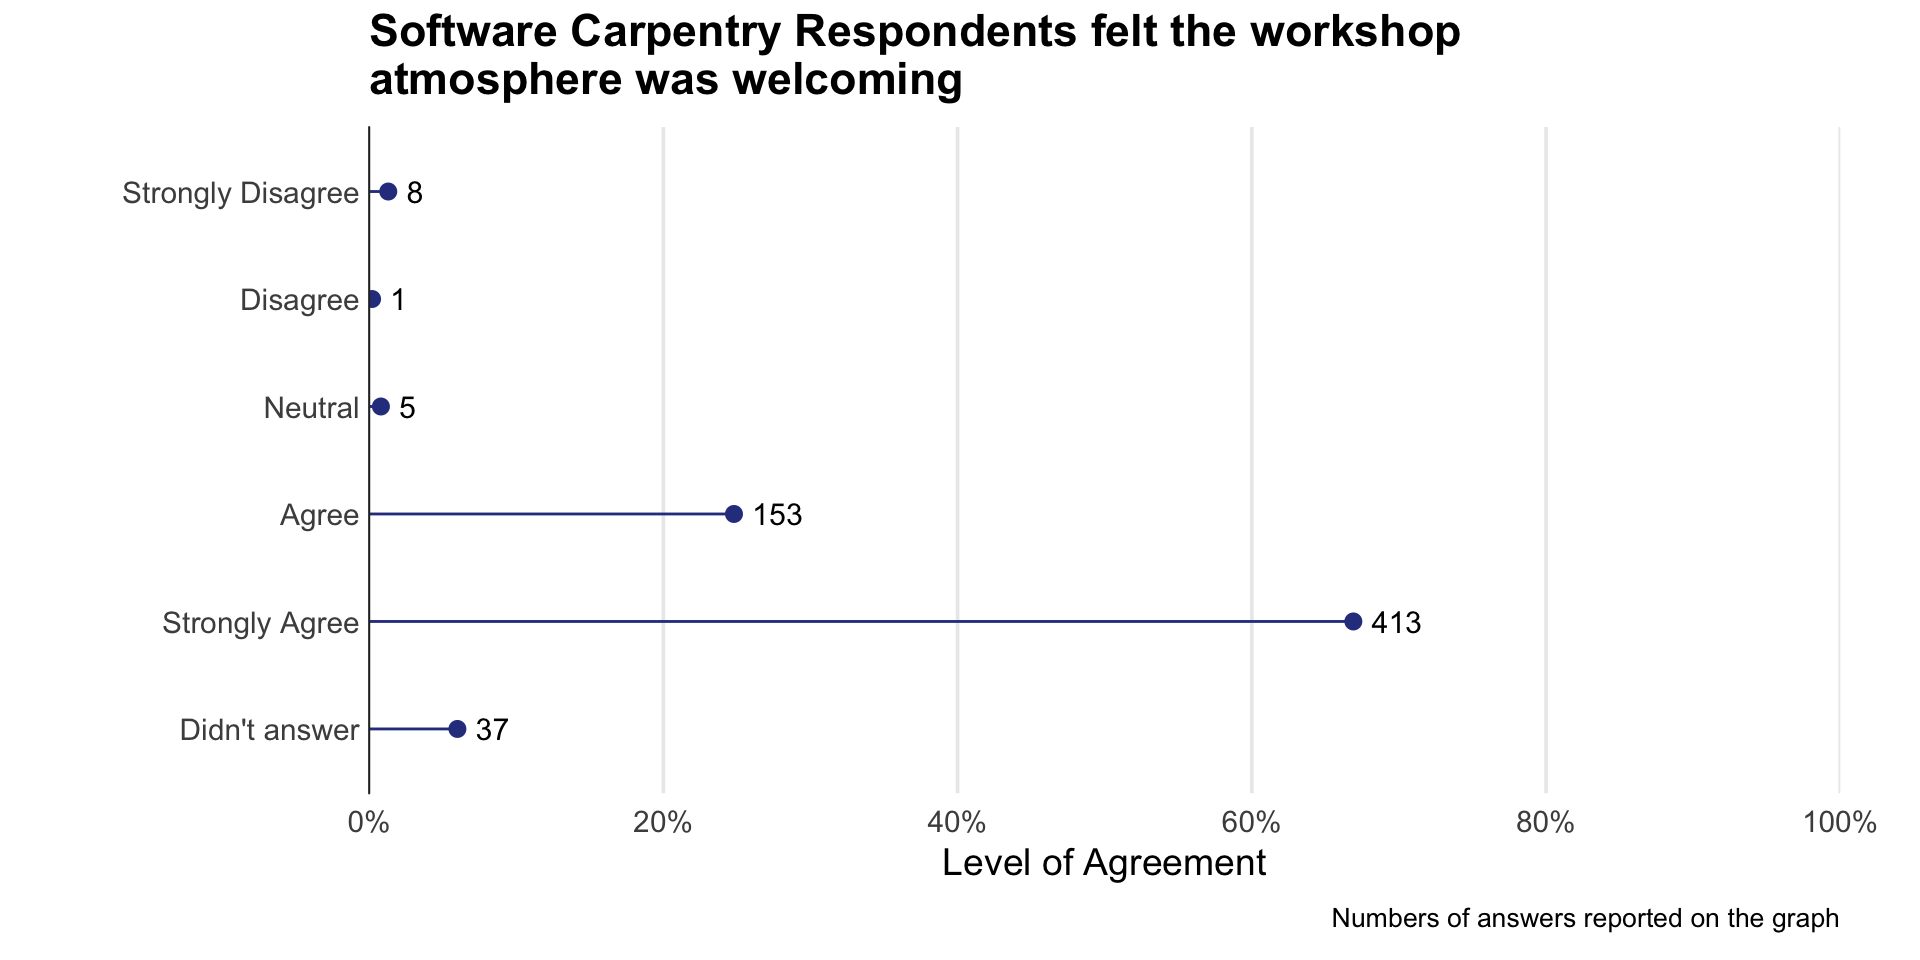
The Carpentries is committed to making participation in our workshops a harassment-free experience for everyone, regardless of who learners are, where they are from, or what their experience is with the tools we teach. We establish norms for interaction by having, discussing, and enforcing a Code of Conduct so that our workshops provide open and inclusive learning environments. 79% of Data Carpentry respondents either agree or strongly agree that they felt comfortable learning in their workshop environment, and 87.1% of Software Carpentry’s respondents agreed or strongly agreed that the workshop atmosphere was welcoming.
Interaction with Instructors and Helpers
Data Carpentry respondents were asked to rate their level of agreement with several statements regarding their instructors’ knowledge, instructional method, and enthusiasm. Their responses are in the figure below, and axis labels correspond to the statements as follows:
- Instructors Knowledge: The instructors were knowledgeable about the material being taught.
- Instructors Interacting: I felt comfortable interacting with the instructors.
- Instructors Enthusiastic: The instructors were enthusiastic about the workshop.
- Instructors Clear Answers: I was able to get clear answers to my questions from the instructors.
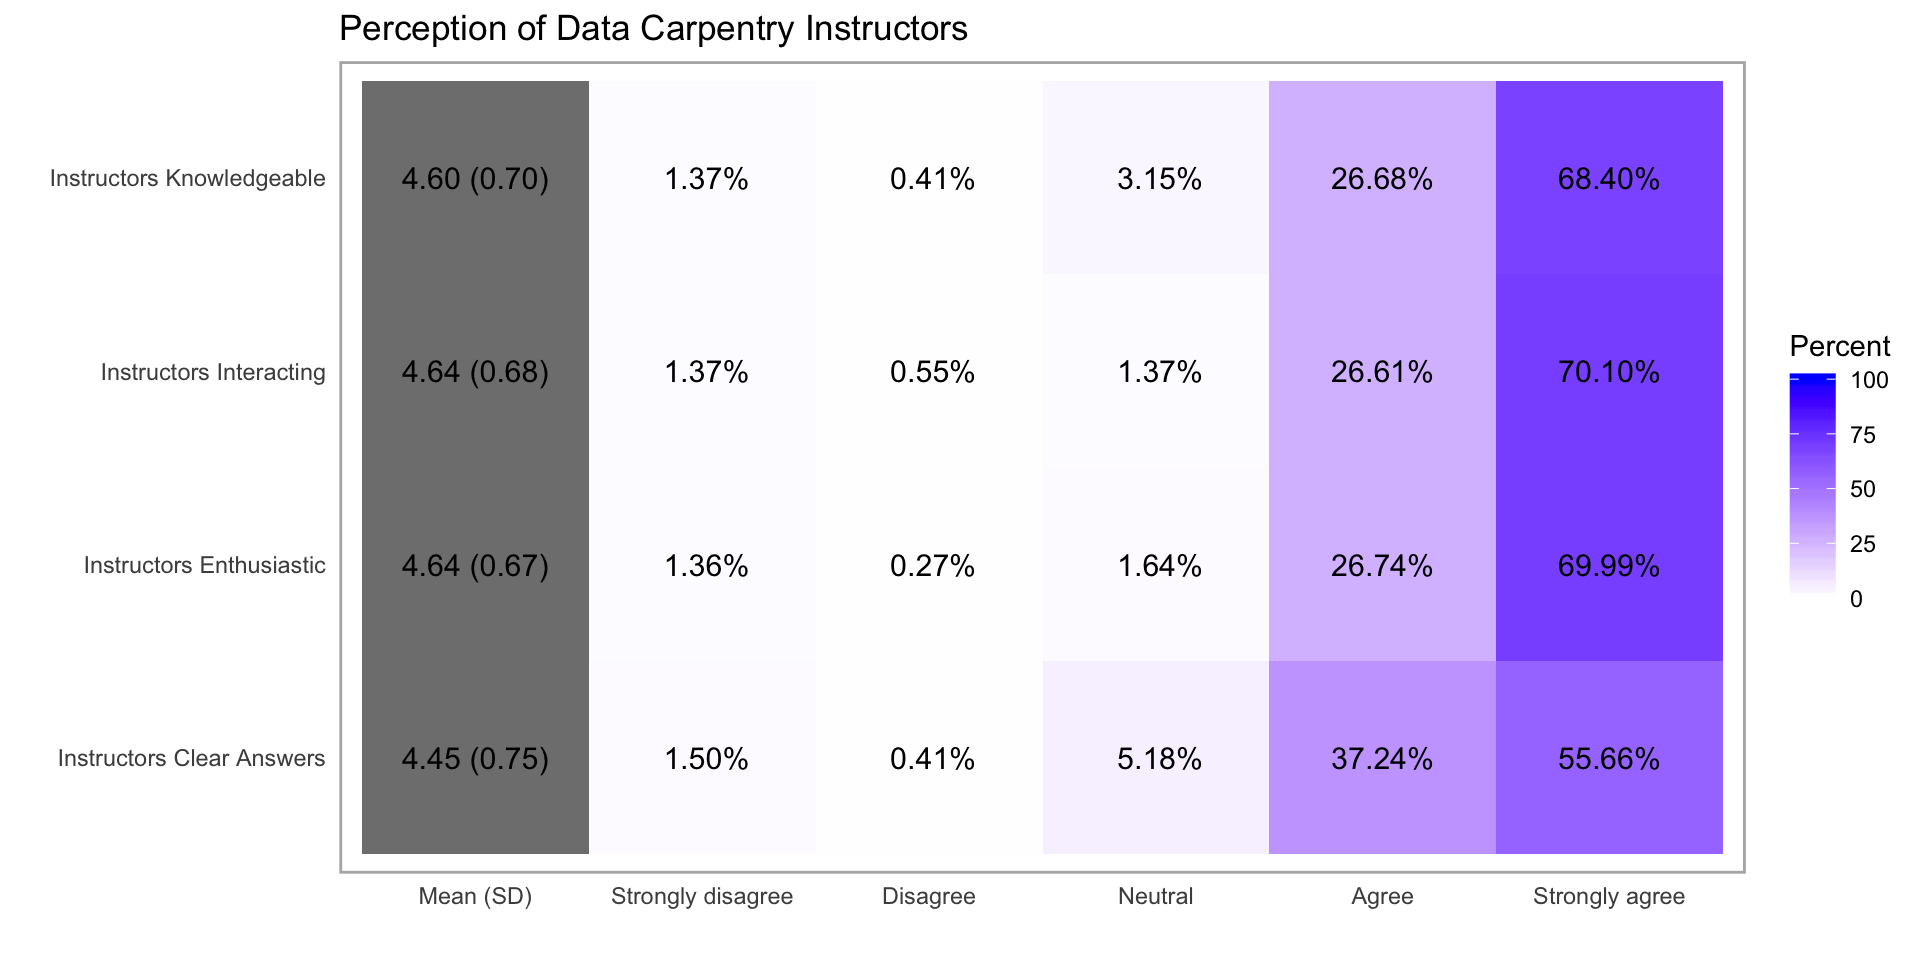
The largest impact we see is that 96.2% of respondents said they felt comfortable interacting with the instructors. We know that our instructors are the reason why our workshops are so well-received. It is also great to see that 94.8% and 96.7% of respondents felt our instructors were knowledgeable about the material being taught, and were enthusiastic about the workshop, respectively. Lastly, 92.9% of respondents felt they were able to get clear answers to their questions from their instructors.
Software Carpentry respondents were asked to rate how they felt instructors and helpers worked as a team, based on the following criteria:
- Considerate: Instructors/Helpers were considerate.
- Enthusiastic: Instructors/Helpers were enthusiastic.
- Clear Answers: Instructors/Helpers gave clear answers to your questions.
- Communicators: Instructors/Helpers were good communicators.
The two neutral centered plots below provide an analysis of respondent’s answers for both instructors and helpers.
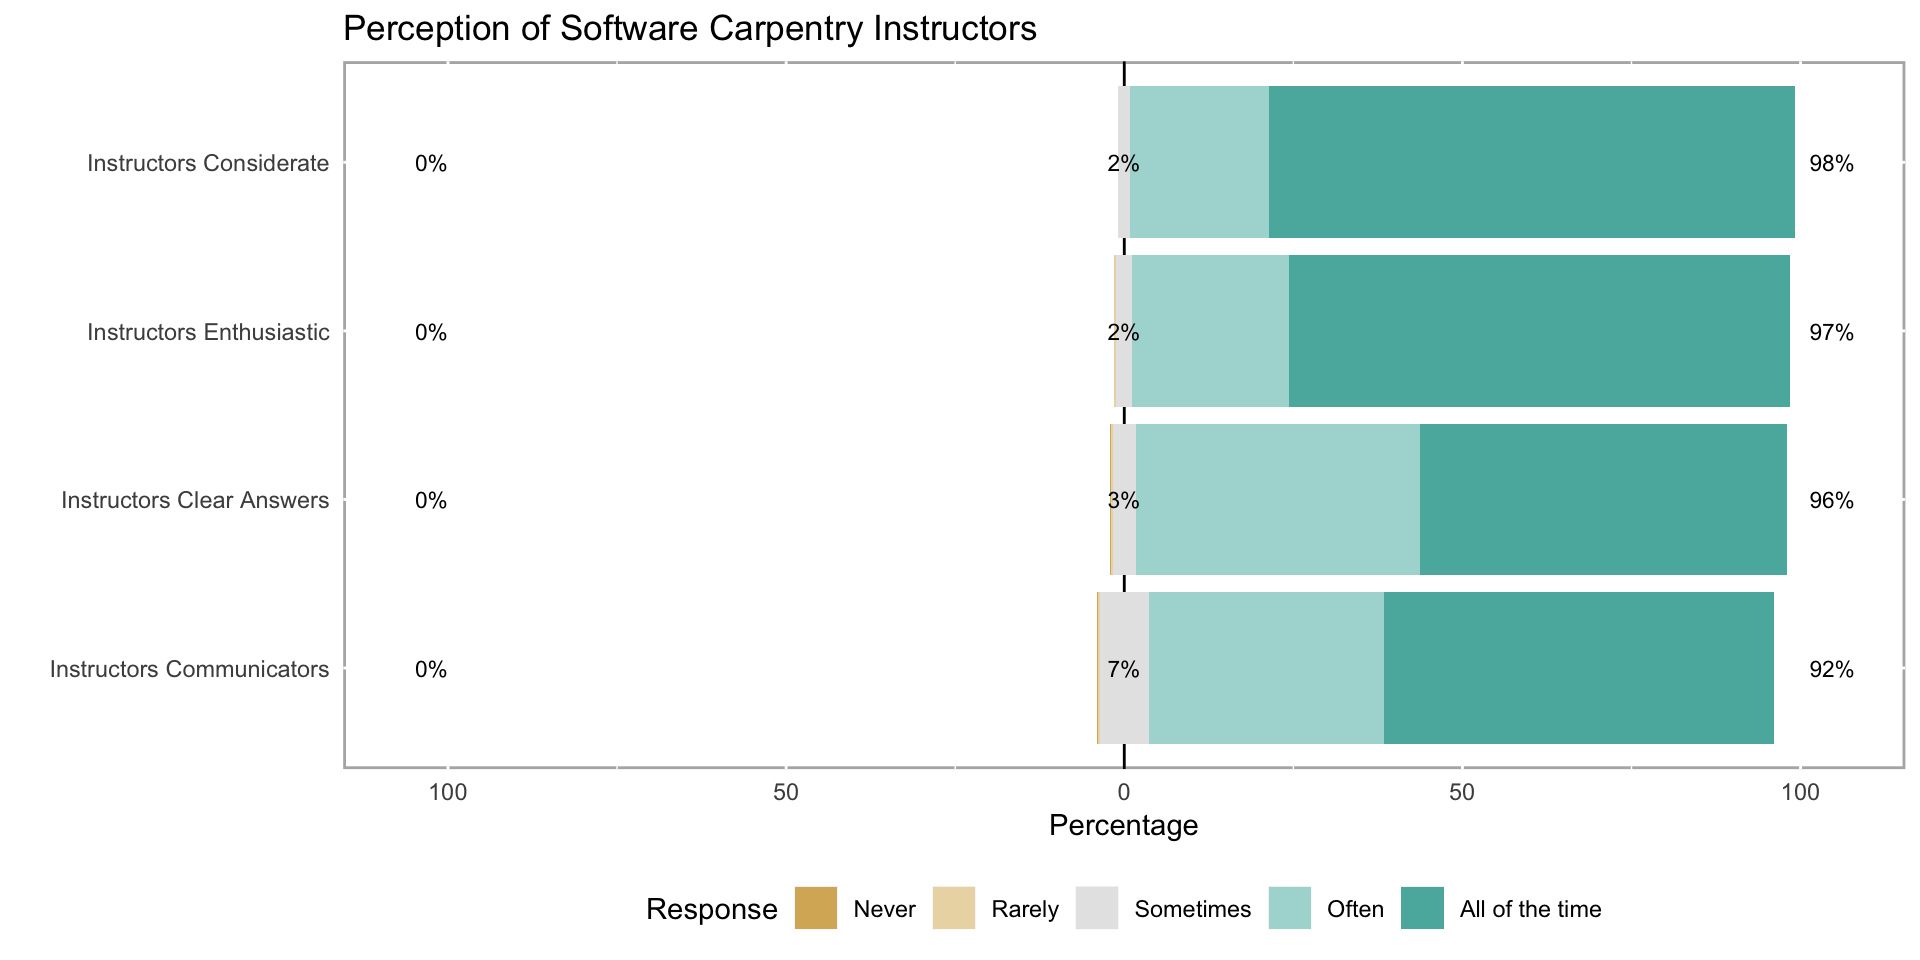
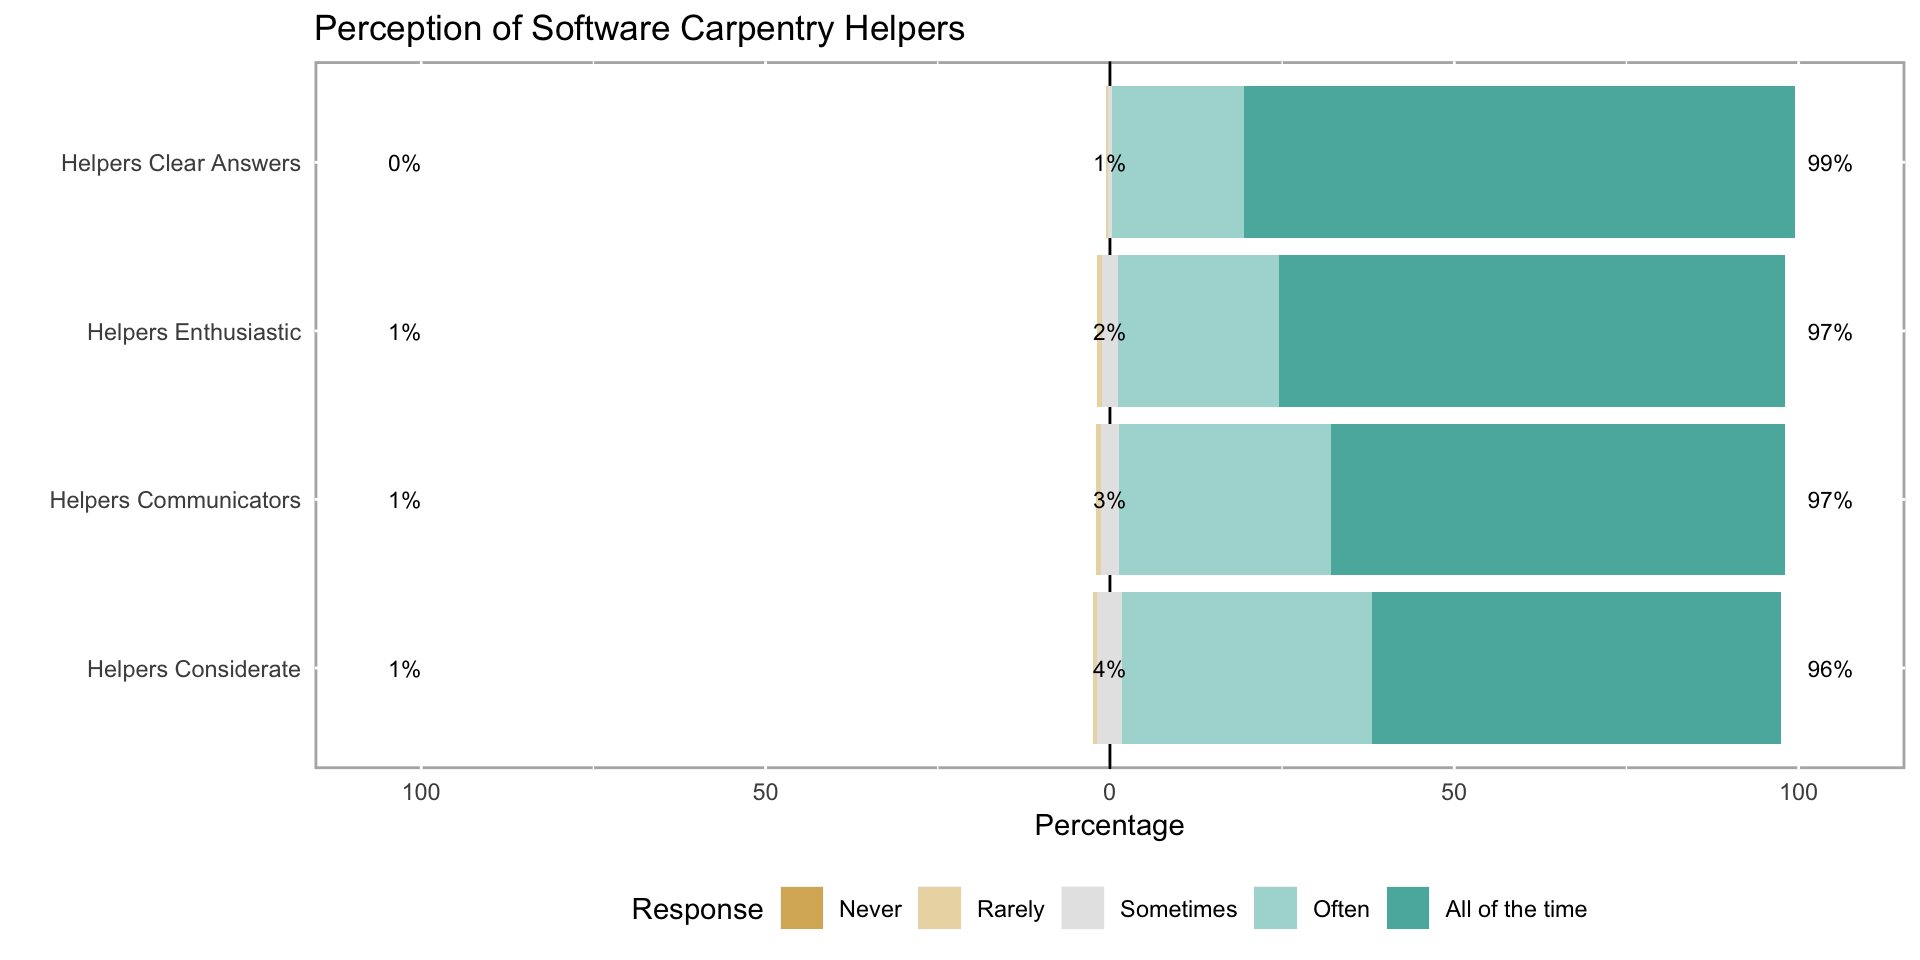
From the figures above, we see that Software Carpentry instructors and helpers are considerate, enthusiastic, give clear answers to questions, and are good communicators. As a whole, our instructors work as a team and are successful in creating a warm and welcoming workshop environment.
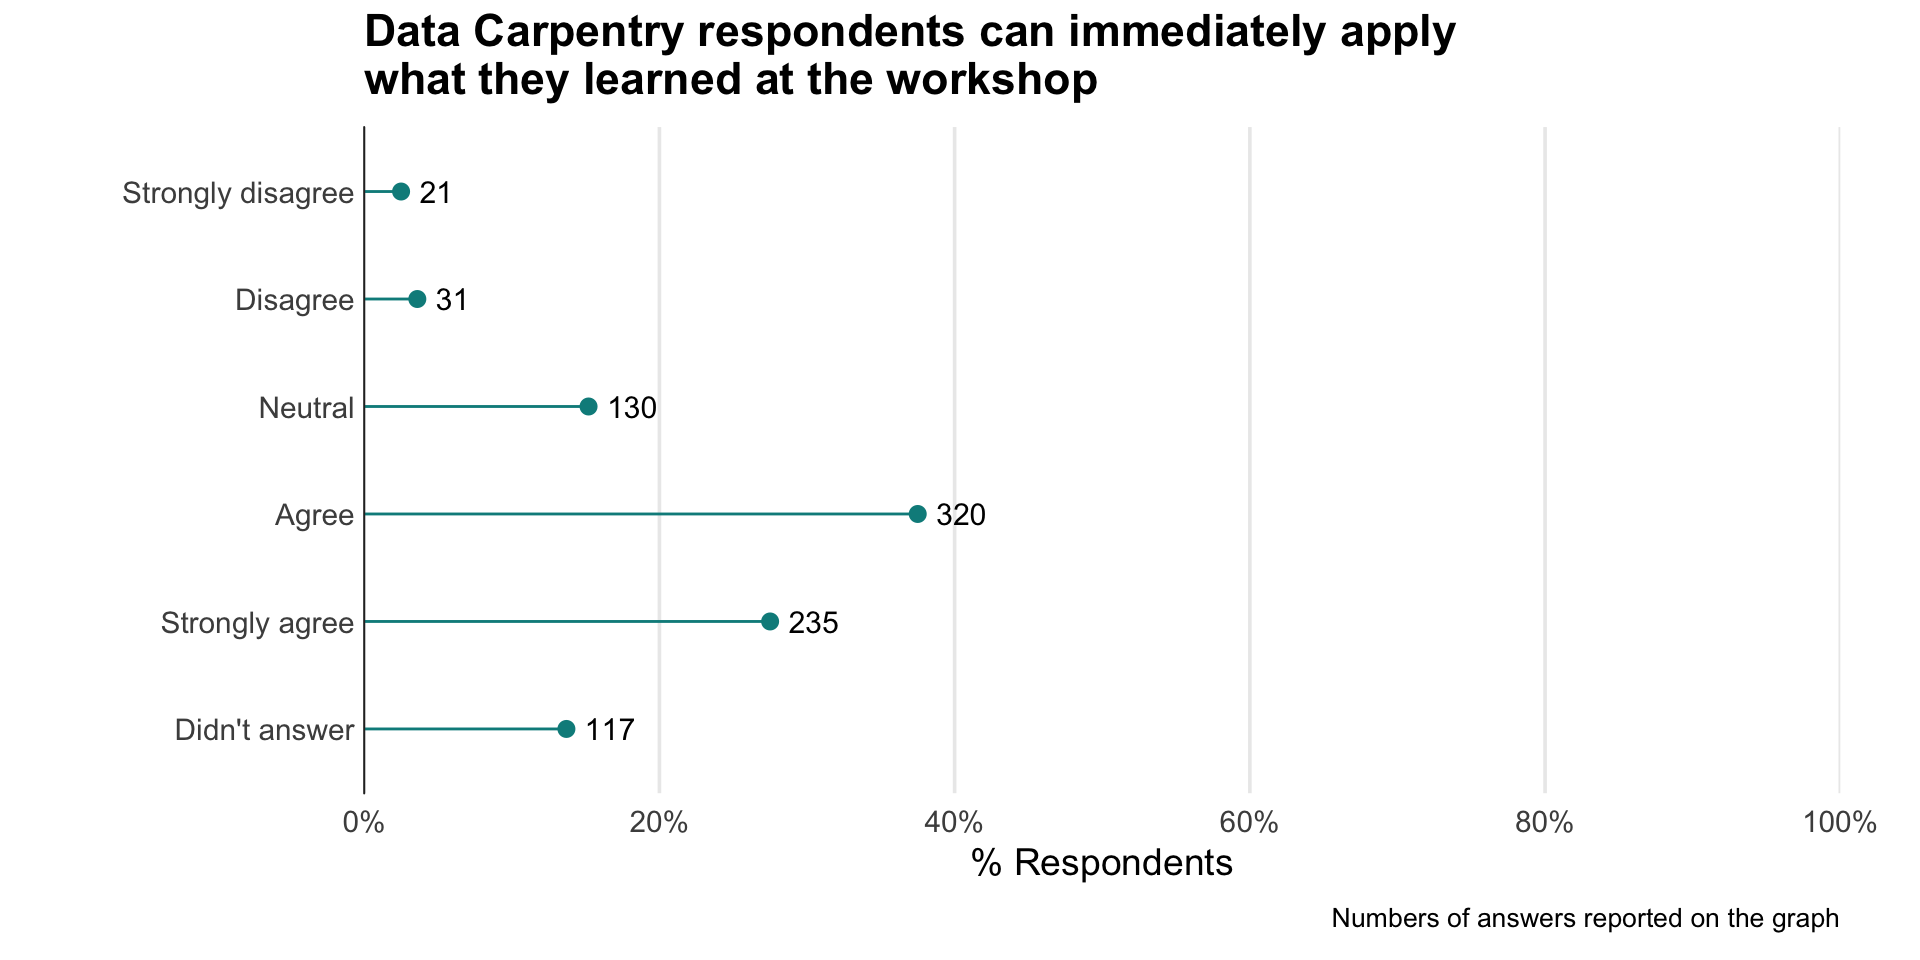
Applicability of the skills learned
One of the goals for Data Carpentry’s lessons is that learners are able to immediately apply what they learned at the workshop. The figure below shows that 65.2% either agree or strongly agree that they were able to apply what they learned immediately.
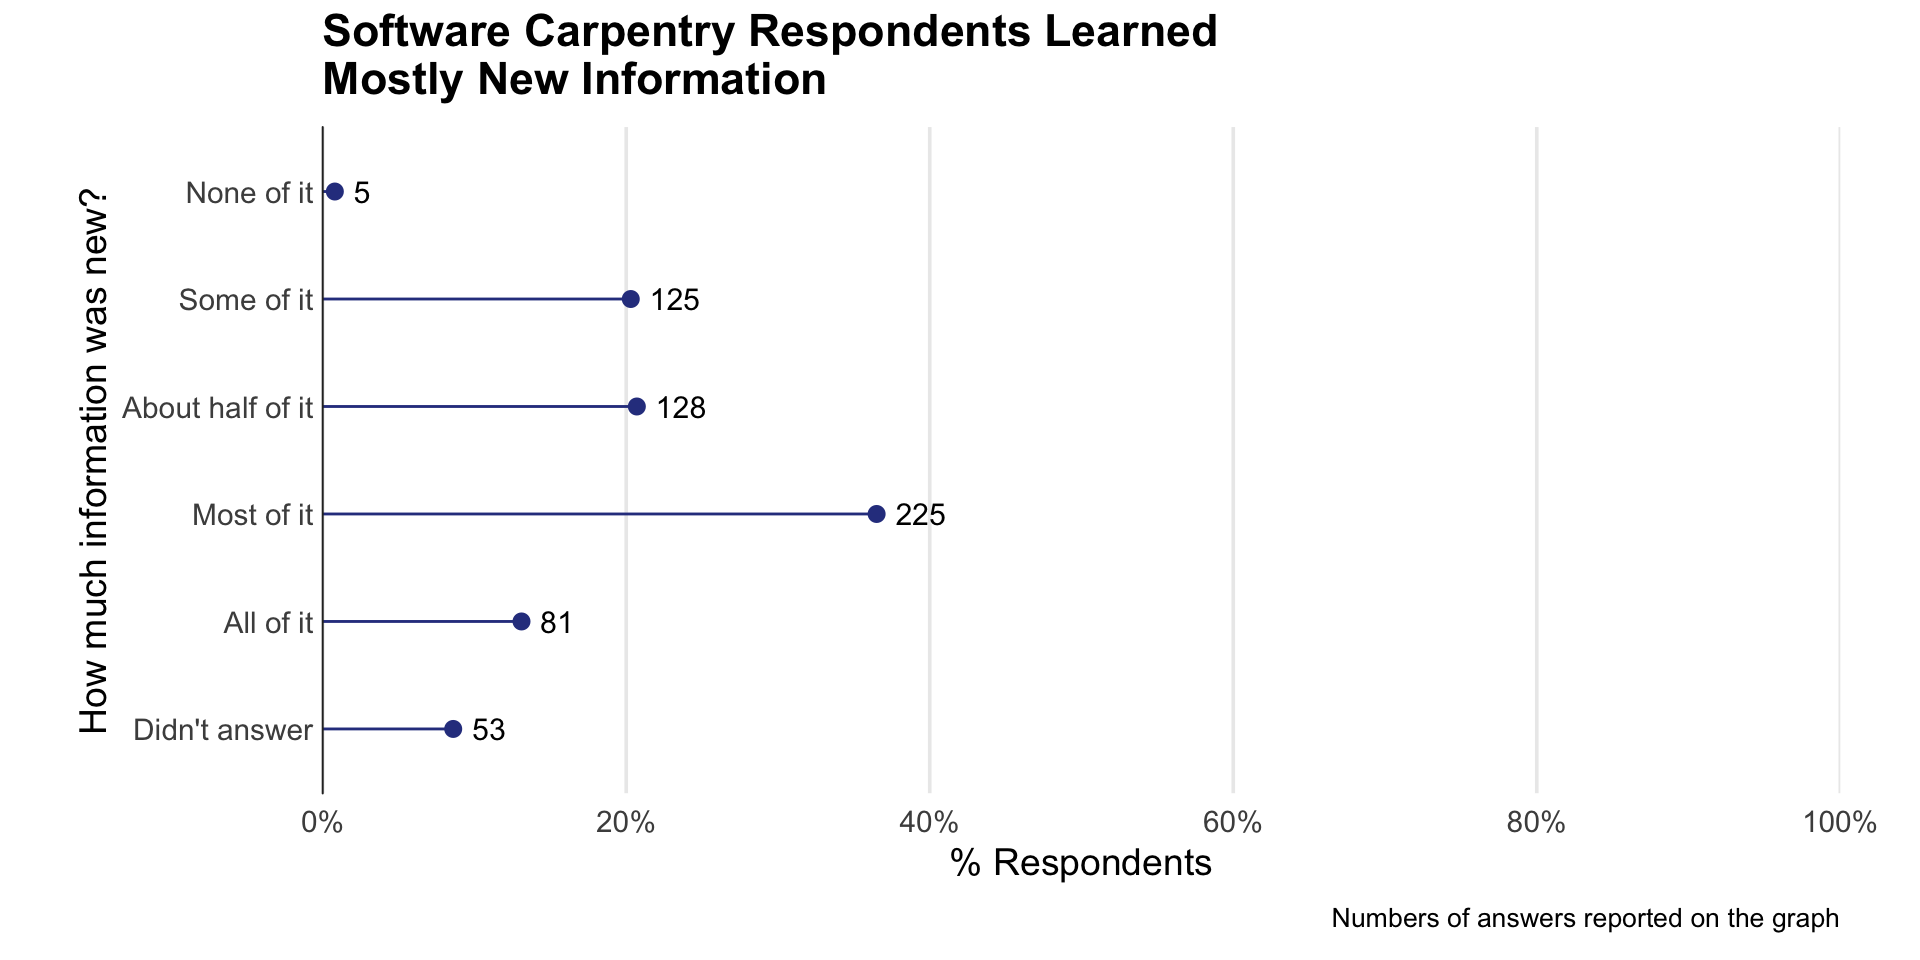
Was the information covered in the workshops new?
As the majority of Software Carpentry learners attend workshops to learn new skills, it is great to see that 47.2% of learners either learned mostly or all new information during the workshop, while another 16.9% learned something new.
Workshop Experience
| Data Carpentry Respondents Having Accessibility Issues | n | % |
|---|---|---|
| Yes | 79 | 9.3 |
| No | 654 | 76.8 |
| Didn’t answer | 119 | 14.0 |
We want to be proactive in ensuring learners have access to whatever they need to participate in a workshop. Both Data Carpentry and Software Carpentry learners were asked to inform workshop organizers if there was anything they needed to make their workshop experience better. Data Carpentry’s respondents were asked if they had accessibility issues, and 9.3% reported they did. After reading the open-ended responses, we can see that the issues were related to not being able to hear and/or see in the back of the room. The Instructor Training Team has been made aware of this, and will be making recommendations.
Net Promoter Score
We use the Net Promoter Score to measure learners’ likelihood of recommending workshops to a friend or colleague. The scoring for this question is on a 0 to 100 scale. Respondents scoring from 0 to 64 are labeled Detractors, and are believed to be less likely to recommend a workshop. Those who respond with a score of 85 to 100 are called Promoters, and are considered likely to recommend a workshop. Respondents between 65 and 84 are labeled Passives, and their behavior falls between Promoters and Detractors.
| Data Carpentry Net Promoter Score | n | % |
|---|---|---|
| Detractor | 32 | 3.8 |
| Passive | 131 | 15.4 |
| Promoter | 565 | 66.3 |
| Didn’t answer | 124 | 14.6 |
77.6% of Data Carpentry respondents who answered this question are promoters (i.e. would recommend a workshop).
For Software Carpentry respondents who answered this questions, 56.9% are promoters.
In summary, Data Carpentry and Software Carpentry workshops provide a warm and welcoming environment, whether learners are brand new to programming or have some experience. Attendees are recommending workshops to their friends and colleagues, and we know that our instructors and helpers are the major reason why.
Effect of Workshops on Learners Self-Reported Perspectives: Skills & Confidence
Learners were asked to rate their level of agreement with the following statements related to Data Carpentry’s workshop goals and learning objectives. The figure below provides a visual representation of their responses, comparing them before the workshop and after the workshop. Axis labels and the corresponding question are organized around 3 themes as follows:
- Efficiency:
- Write Program: I can write a small program/script/macro to solve a problem in my own work.
- Programming Efficient: Using a programming language (like R or Python) can make me more efficient at working with data.
- Reproducibility:
- Raw Data: Having access to the original, raw data is important to be able to repeat an analysis.
- Analyses Easier: Using a programming language (like R or Python) can make my analyses easier to reproduce.
- Self-efficacy
- Search Online: I know how to search for answers to my technical questions online.
- Overcome Problem: While working on a programming project, if I get stuck, I can find ways of overcoming the problem.
- Programming Confident: I am confident in my ability to make use of programming software to work with data.
The scoring for the above factors ranges from strongly disagree (1) to strongly agree (5).
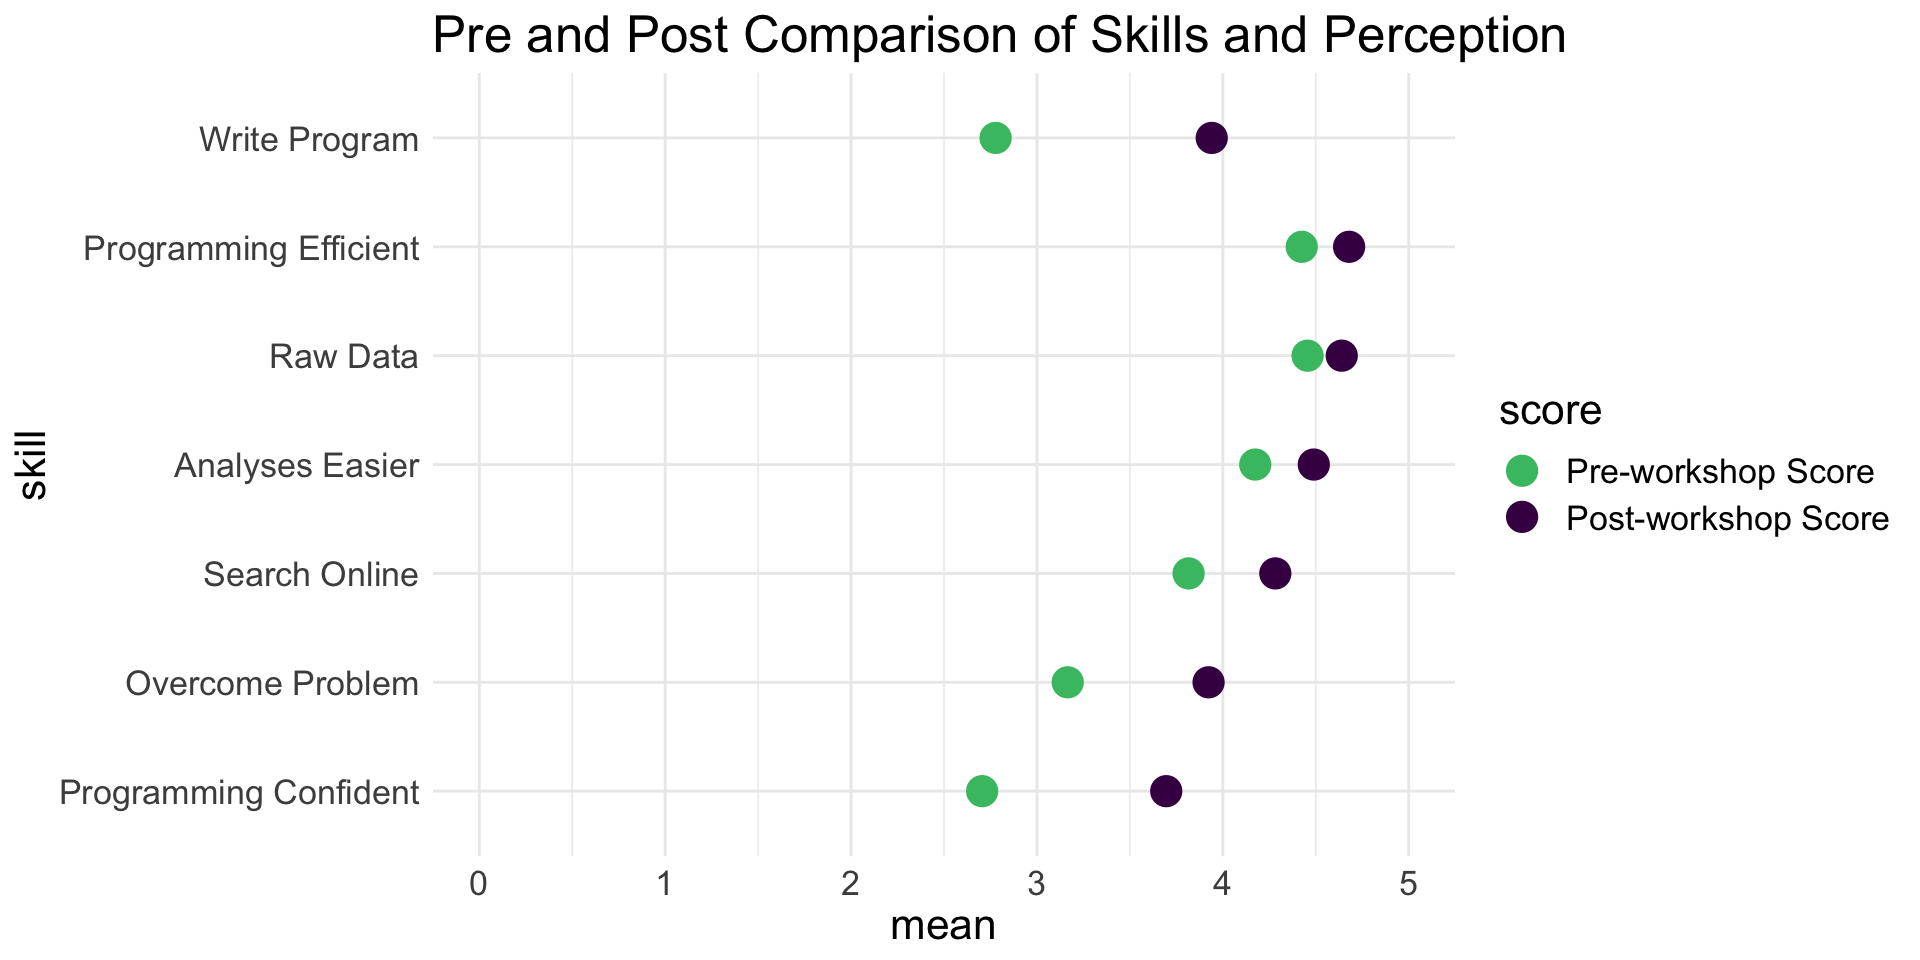
The comparison above is paired, meaning, we are comparing those who provided us with a unique identifier and who completed both the pre- and post-workshop survey. This figure includes 411 responses. The data shows, for multiple factors, a full point increase in mean score. We are significantly impacting respondents’ confidence in programming, ability to write programs to solve problems, and ability to overcome problems if they get stuck.
In the figures below, we show another representation of the pre- and post-comparison of respondents skills and perspectives. The figures below include the data for all learners, not only those who provided a unique identifier and took both the pre- and post-workshop surveys. What we see is a shift in the distribution for each factor, meaning, respondents’ self-reported confidence and ability shifted in positive directions.
The neutral centered graphs below provide an even clearer picture of the shift in respondents’ self-reported confidence and skills.
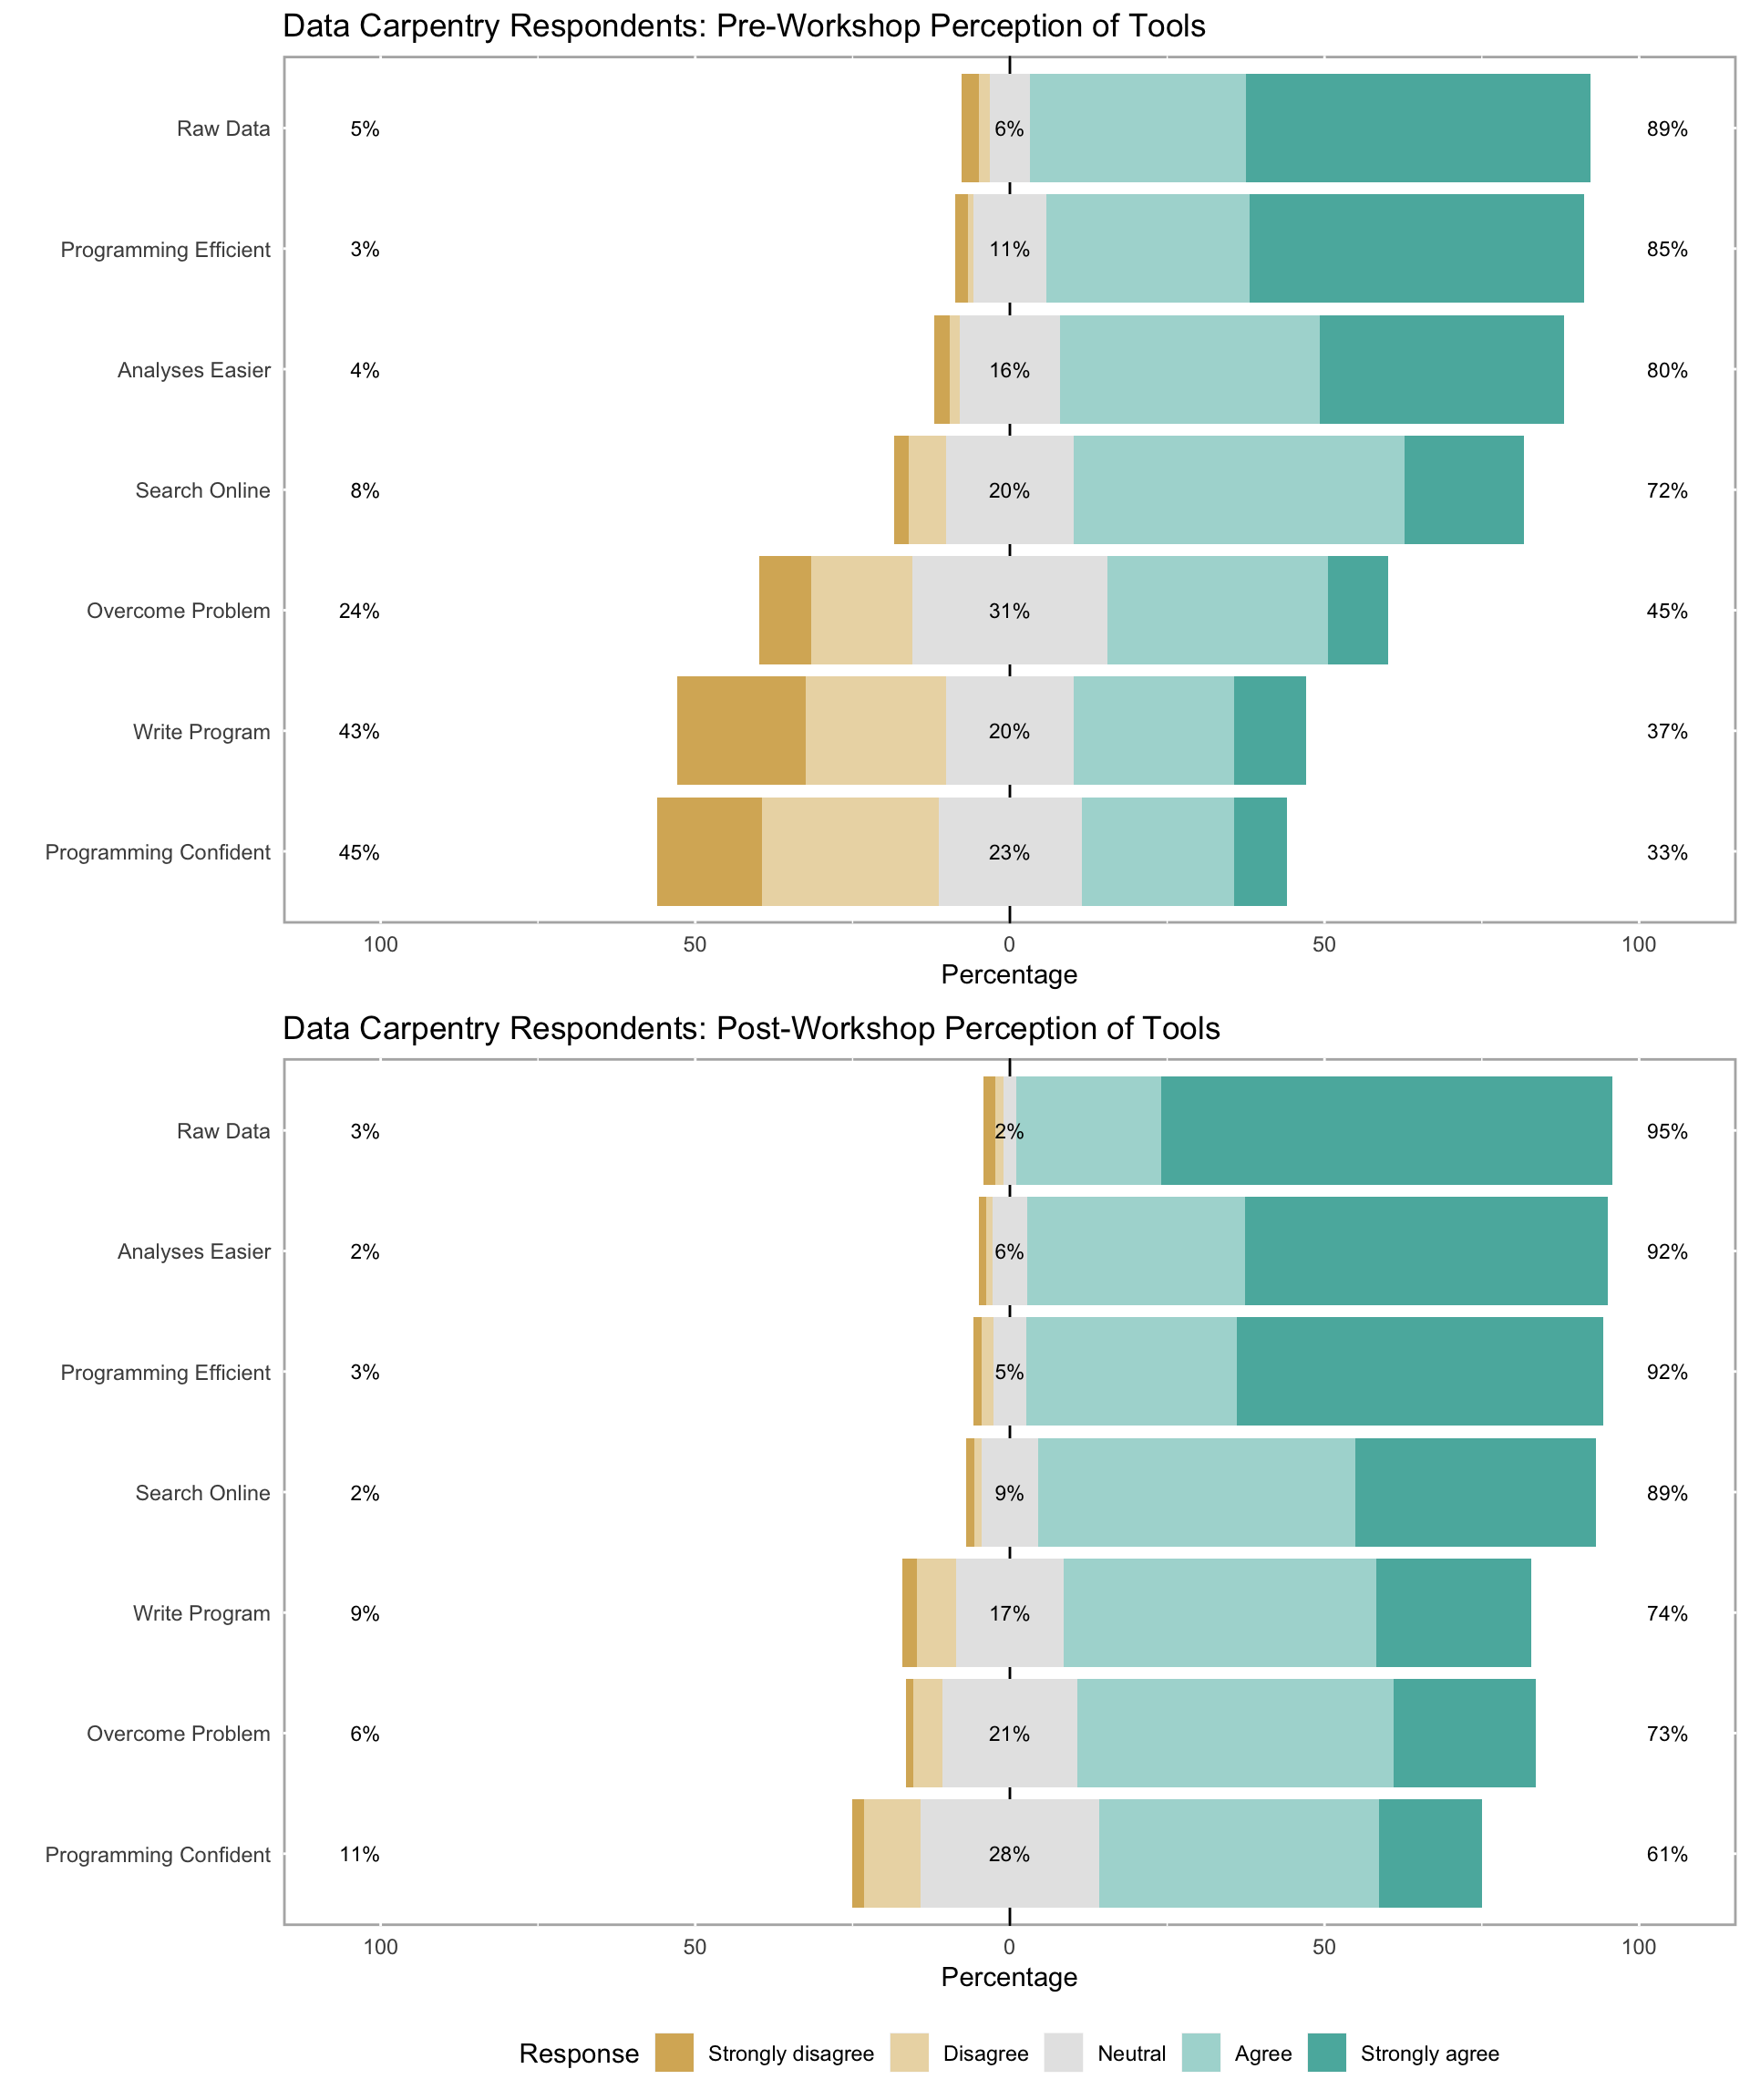
It is interesting to see the shift in neutrality between the pre-workshop scores and post-workshop scores, especially for Programming Efficient. There was a higher percentage of learners beginning the workshop who felt programming with R or Python can make them more efficient at working with data. Contrarily, confidence in using programming to work with data increased from 33% to 61%.
Software Carpentry Respondents were asked to tell us about their experience with these topics before the workshop:
- R
- Unix Shell
- SQL
- Python
- Version Control with Git
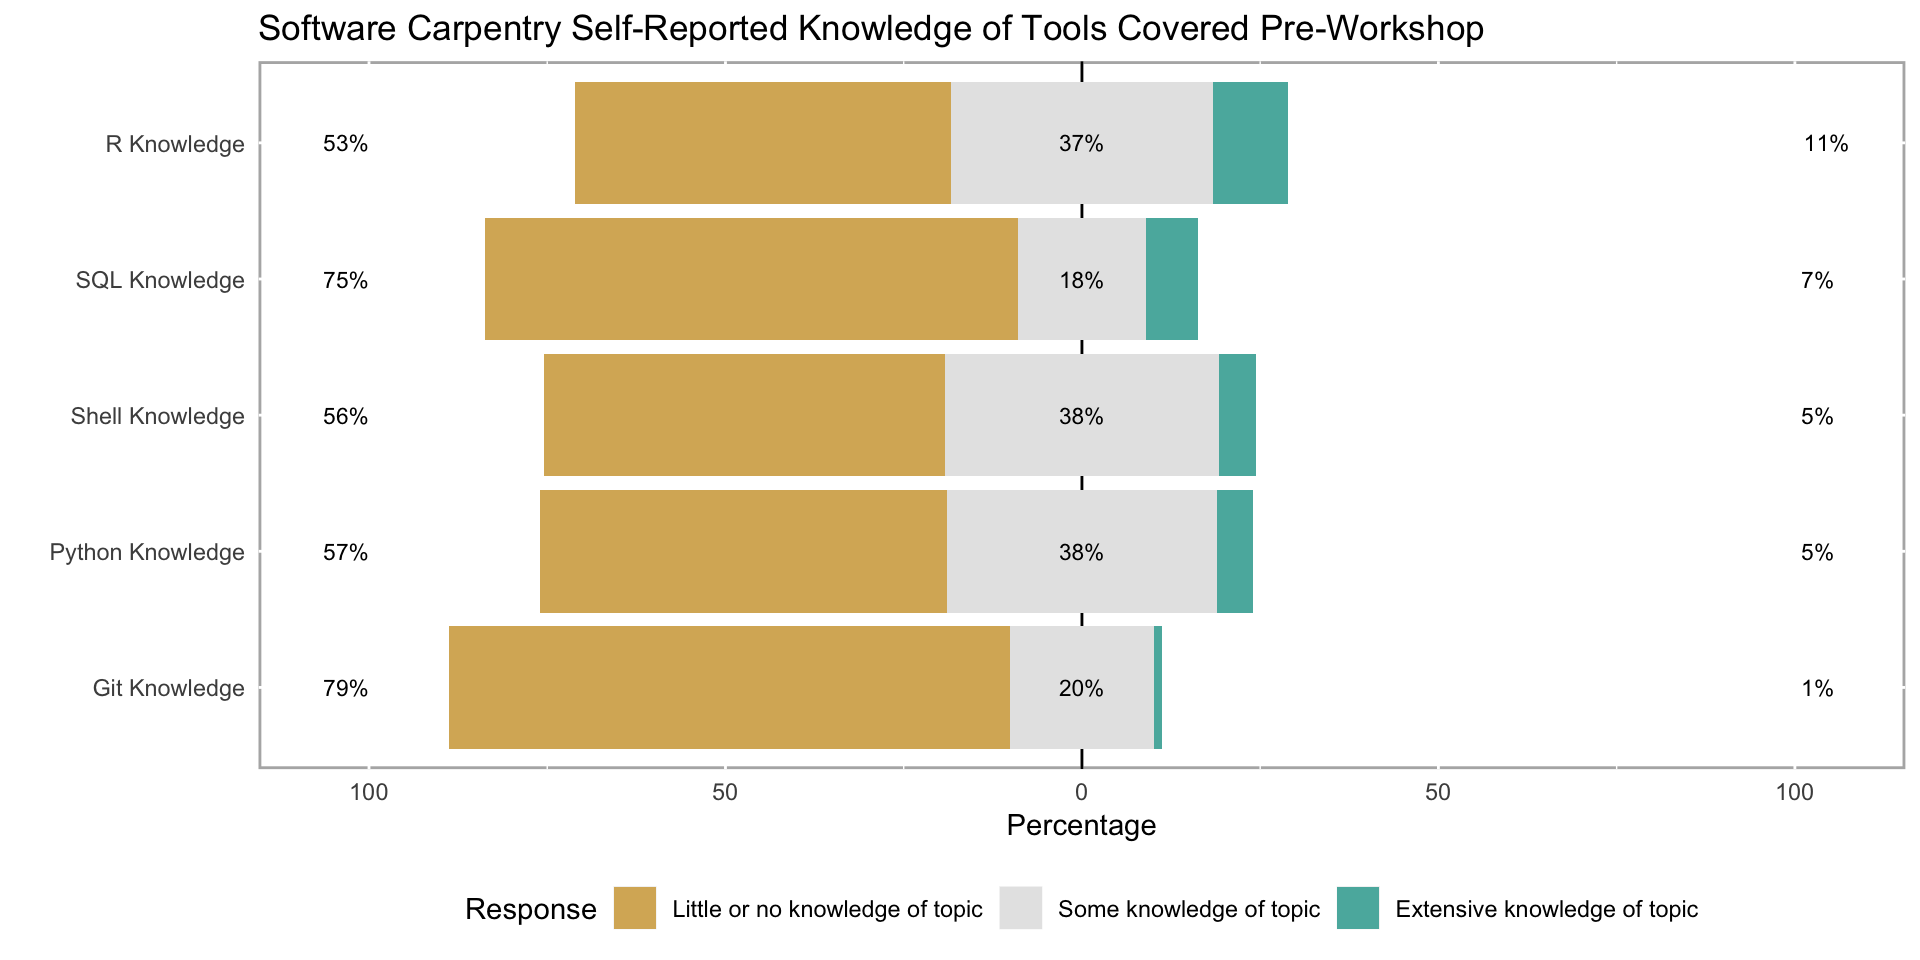
From the figure, we see that learners consider themselves beginners from the topics covered in our workshops. When asked their knowledge of the tools covered in their workshops, learners rated their knowledge as extensive from 2% to 10% for “Git Knowledge” and “R Knowledge”.
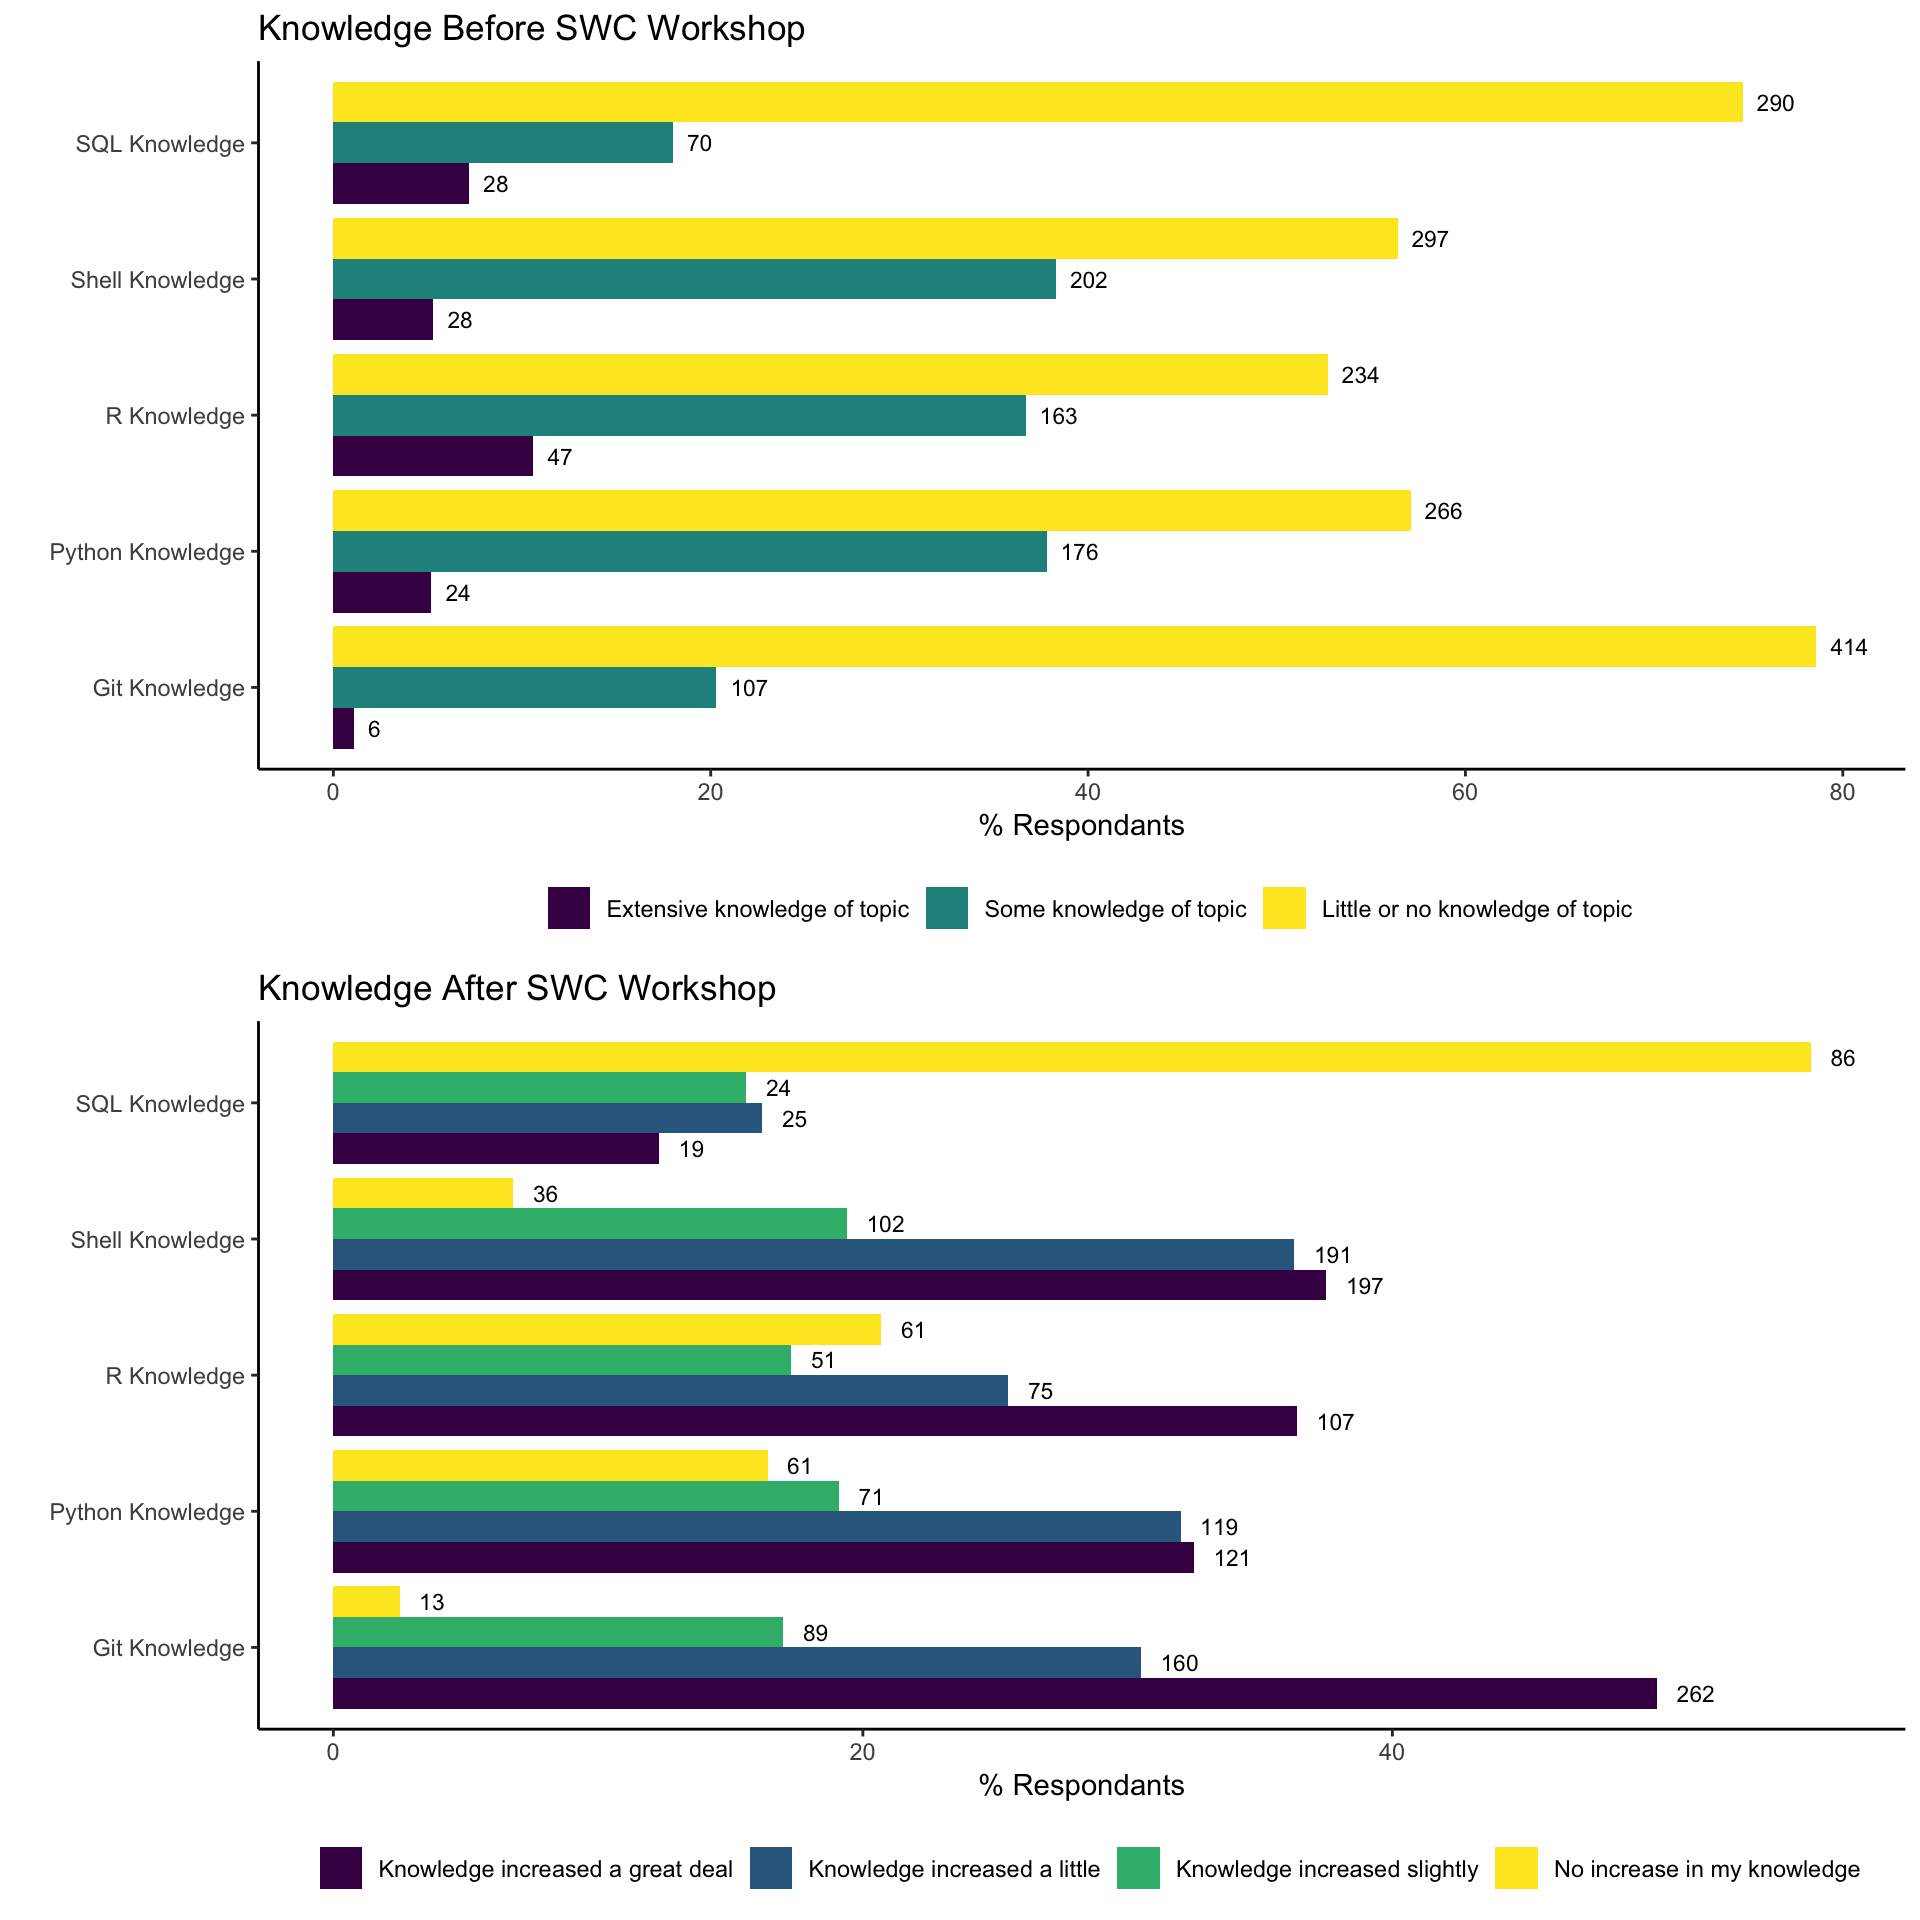
The following is a comparison of Software Carpentry respondents’ knowledge about the tools before compared to after the workshop. We see clearly that after the workshop, respondents’ knowledge of Git, Python, R, and the Unix Shell had increased a great deal.
Respondent Ability to Perform Computing Tasks
Motivation is important, but being confident in your ability to complete specific computing tasks is an equally important goal of Software Carpentry. The grid below shows respondents’ self-reported ability to complete tasks including:
- Pipes: Using pipes to connect shell commands
- Loops: Writing a ‘for loop’ to automate tasks
- Git: Initializing a repository with git
- Function: Writing a function
- Import Library: Importing a library or package in R or Python
- Unit Test: Writing a unit test in Python or R
- SQL Query: Writing an SQL query
It also provides their self-reported level of confidence in being able to complete the tasks above after completing the workshop.
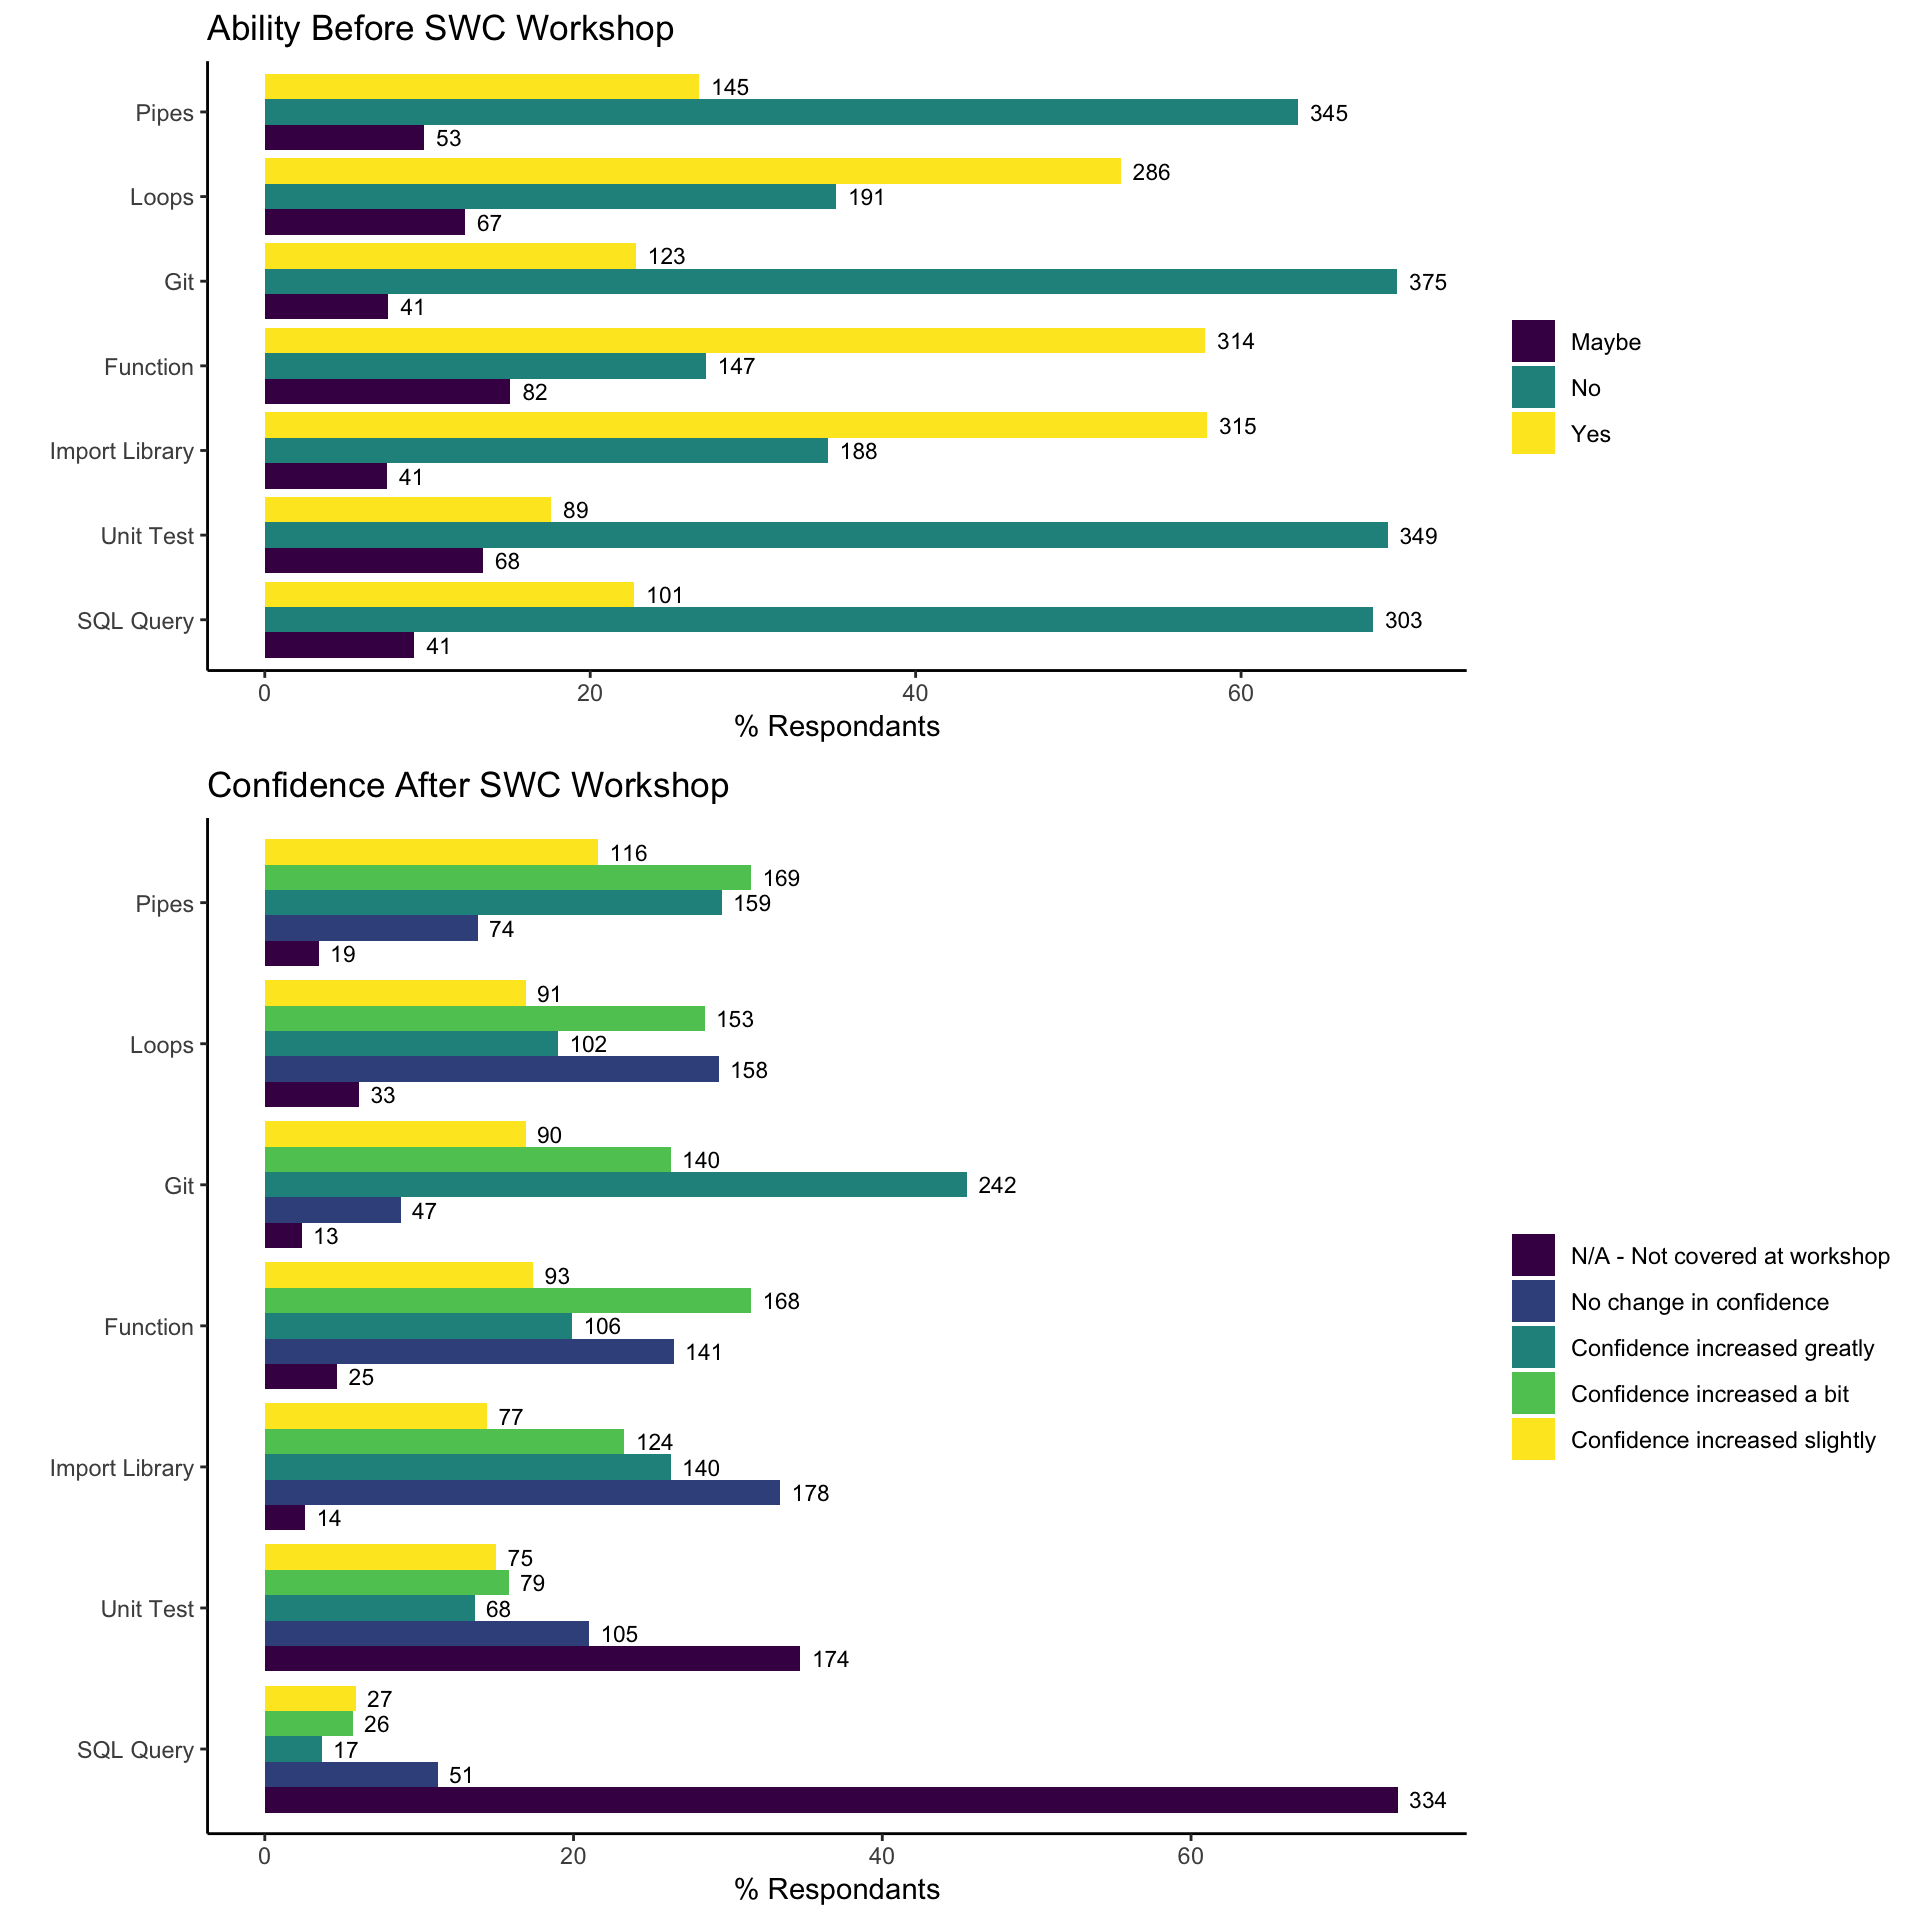
These figures tell us that, before the workshop, between 32.2% and 73.4% of the respondents did not feel they could initialize a repository in Git, write a ‘for loop’ to automate tasks, use pipes to connect shell commands, write a SQL query, and/or write a unit test in R or Python. 29% of learners felt their confidence increased greatly with respect to importing a library or package in R or Python. We consider this significant as it is one of the fundamental skills that allows learners to be successful in the other areas mentioned above.
In summary, respondents experienced increased confidence in their ability to perform specific computing tasks and solve problems, or at least search for answers to problems, as a result of participating in Software Carpentry and Data Carpentry workshops.
Demographics
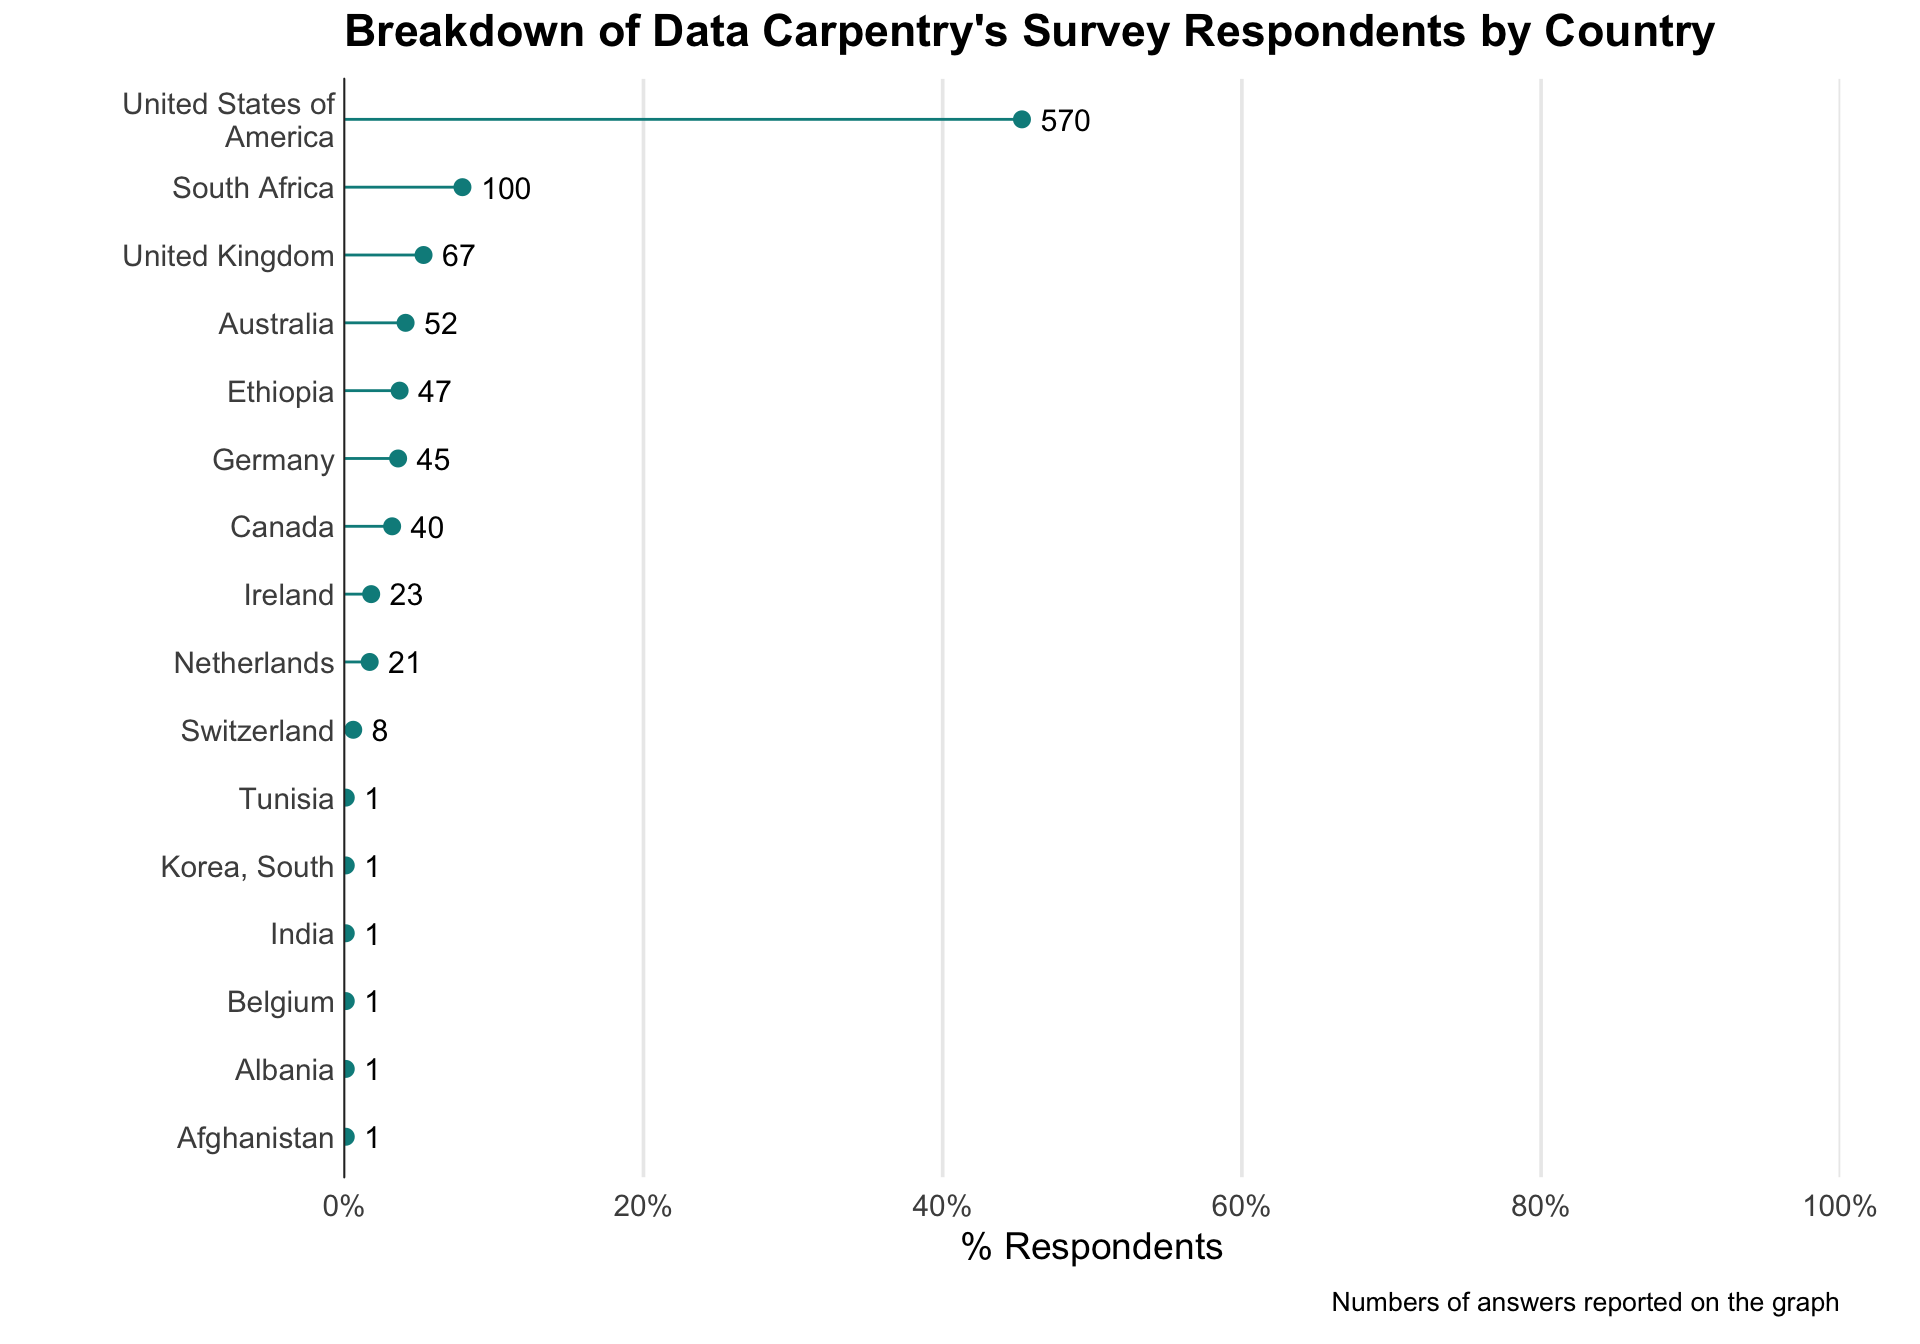
Countries
The Carpentries is a global community that has recognized the importance of bringing people to data through high-impact trainings. Though the majority of Data Carpentry respondents report attendeding a workshop in the United States of America (45.3%), we also see that learners attend workshops in African (e.g., Ethiopia 3.7%) and European (e.g., Switzerland 0.6%) countries. Note that we haven’t held workshops in Albania or Afghanistan, learners who selected these countries interpreted this question to indicate their country of origin, or made a mistake when selecting their answers.
| Software Carpentry Workshops in US | n | % |
|---|---|---|
| Yes | 6468 | 45.7 |
| No | 4640 | 32.8 |
| Didn’t answer | 3046 | 21.5 |
In Software Carpentry’s pre-workshop survey, respondents are asked whether or not their workshop will take place in the United States. 45.7% of respondents attended a U.S. workshop.
Learners’ discipline
| Data Carpentry’s Respondents by Discipline | n | % |
|---|---|---|
| Life Sciences | 444 | 35.6 |
| Agricultural or Environmental Sciences | 307 | 24.6 |
| Bioinformatics/Genomics | 292 | 23.4 |
| Biomedical/Health Sciences | 288 | 23.1 |
| Other | 133 | 10.7 |
| Social Sciences | 122 | 9.8 |
| Mathematics or Statistics | 101 | 8.1 |
| Earth Sciences | 96 | 7.7 |
| Engineering | 91 | 7.3 |
| Computer Science | 88 | 7.1 |
| Business/Economics | 57 | 4.6 |
| Physical Sciences | 53 | 4.3 |
| Humanities | 53 | 4.3 |
| Library Sciences | 28 | 2.2 |
As previously mentioned, Data Carpentry’s curricula is domain-specific to Ecology, Genomics, Geospatial, and the Social Sciences. We see this in the distribution of respondents by discipline. 35.6% are in the Life Science, while 24.6%, 23.4%, and 23.1% are in Agricultural or Environmental Sciences, Bioinformatics/Genomics, and Biomedical/Health Sciences, respectively.
| Software Carpentry’s Respondents by Discipline | n | % |
|---|---|---|
| Life Science - Organismal/systems (ecology, botany, zoology, microbiology, neuroscience) | 2694 | 24.9 |
| Life Sciences (Genetics, genomics, bioinformatics ) | 2680 | 24.8 |
| Other | 1695 | 15.7 |
| Mathematics/statistics | 940 | 8.7 |
| Physics | 801 | 7.4 |
| Planetary sciences (geology, climatology, oceanography, etc.) | 786 | 7.3 |
| Civil, mechanical, chemical, or nuclear engineering | 692 | 6.4 |
| Medicine and/or Pharmacy | 684 | 6.3 |
| Social sciences | 591 | 5.5 |
| Chemistry | 574 | 5.3 |
| Economics/business | 481 | 4.5 |
| Psychology | 417 | 3.9 |
| Library and information science | 373 | 3.5 |
| High performance computing | 360 | 3.3 |
| Humanities | 318 | 2.9 |
| Education | 264 | 2.4 |
| Space sciences | 161 | 1.5 |
Software Carpentry’s respondent base also has a majority Life Sciences base; however we also see representation from those working in Psychology, High Performance Computing, and Chemistry.
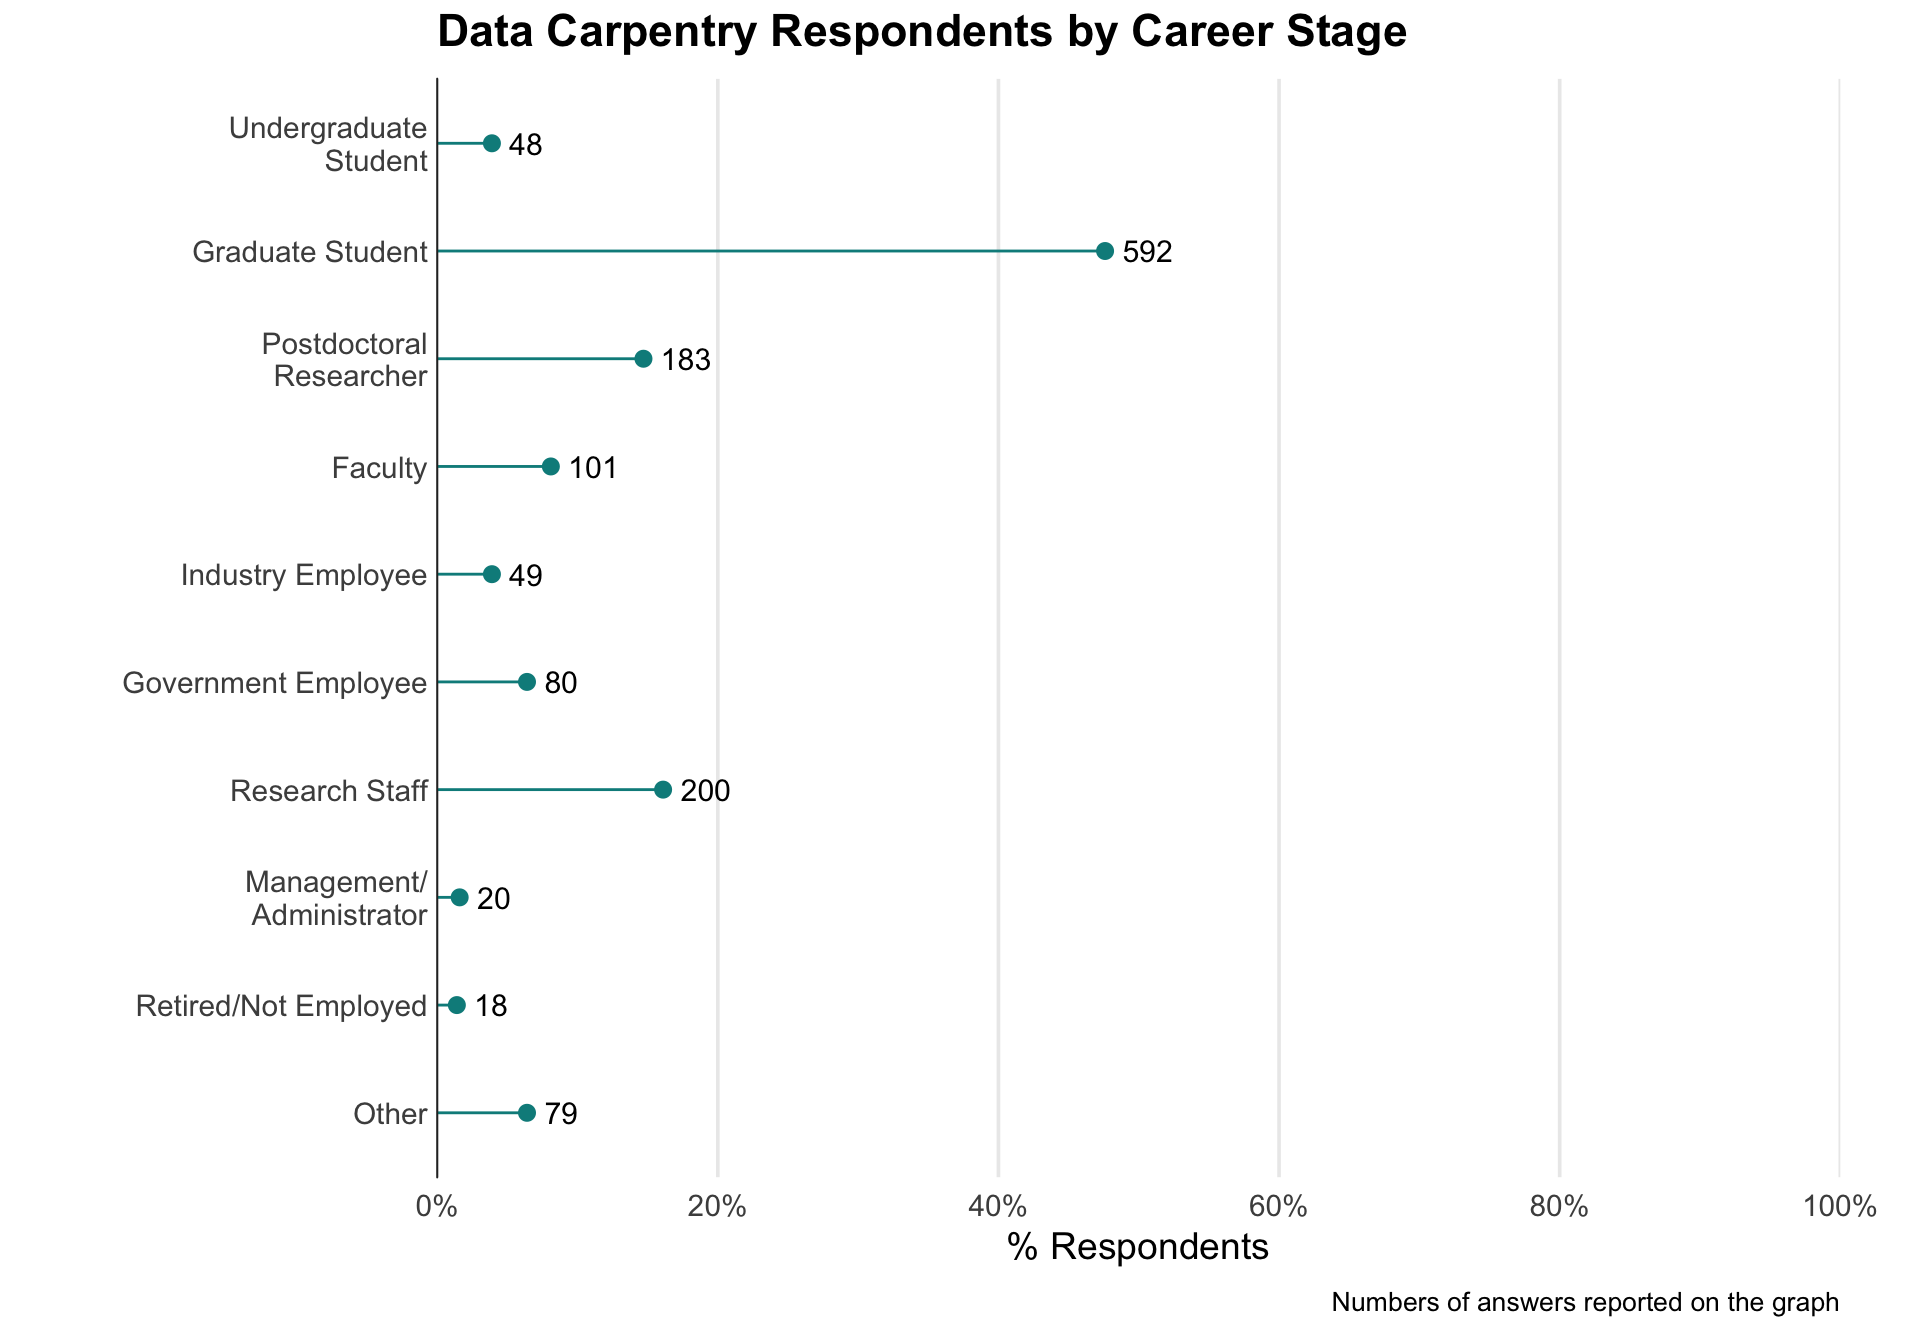
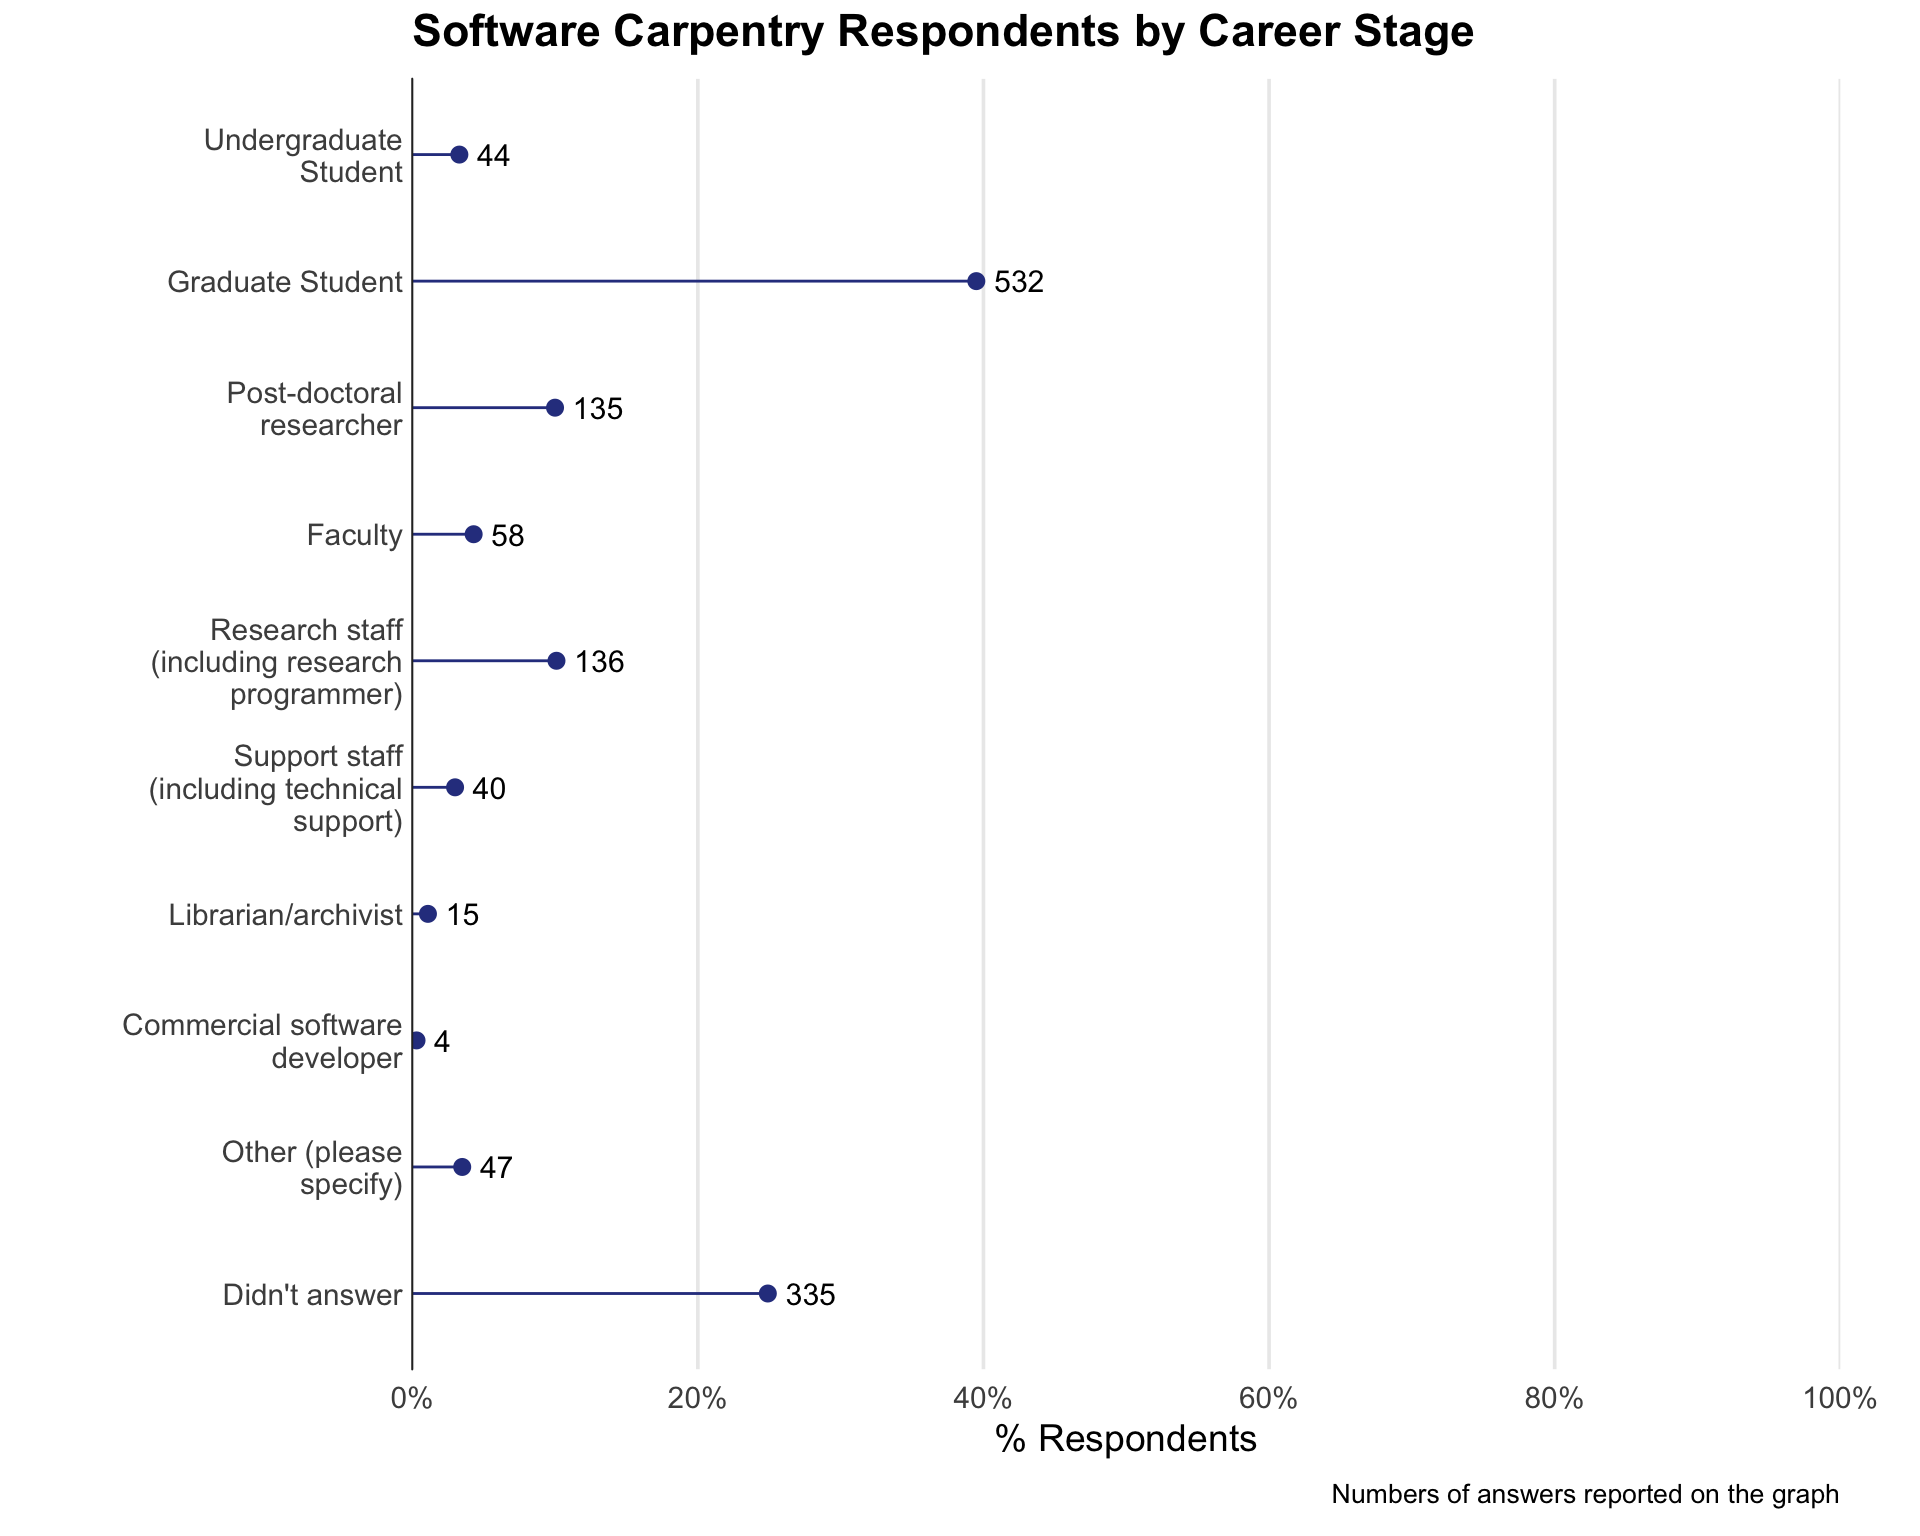
Learners’ career stage
| Data Carpentry’s Respondents by Career Stage | n | % |
|---|---|---|
| Graduate Student | 592 | 47.6 |
| Research Staff | 200 | 16.1 |
| Postdoctoral Researcher | 183 | 14.7 |
| Faculty | 101 | 8.1 |
| Government Employee | 80 | 6.4 |
| Other | 79 | 6.4 |
| Industry Employee | 49 | 3.9 |
| Undergraduate Student | 48 | 3.9 |
| Management/Administrator | 20 | 1.6 |
| Retired/Not Employed | 18 | 1.4 |
As many of The Carpentries’ workshops are hosted on university or college campuses and other research-based communities, it is no surprise that the majority of respondents are Graduate Students (47.6% - DC, 35.4% - SWC), Research Staff (16.1% - DC,9.6% - SWC), and Postdoctoral Researchers (1.4% - DC, 12.3% - SWC).
Learners’ operating system
| Operating System Respondents Use in Data Carpentry Workshops | n | % |
|---|---|---|
| Windows | 661 | 53.3 |
| Apple/Mac OS | 512 | 41.3 |
| UNIX/Linux | 50 | 4.0 |
| Not sure | 17 | 1.4 |
In our workshops, we recommend that learners use their own personal laptop computers. It is important for learners to leave the workshop with their own machine set up to do real work. Our instructors teach on three major platforms: Windows, Mac OS X, and UNIX/Linux. We see a very close representation of Windows (53.3%) and Apple/Mac OS (41.3%) users in our Data Carpentry workshops, and even a few UNIX/Linux users (4%).
Gender and Racial/Ethnic Identity
| Data Carpentry’s U.S. Respondents’ Gender Identity | n | % |
|---|---|---|
| Female | 322 | 56.6 |
| Male | 223 | 39.2 |
| Transgender female | 2 | 0.4 |
| Transgender male | 0 | 0.0 |
| Gender variant/non-conforming | 0 | 0.0 |
| Prefer not to answer | 8 | 1.4 |
| Didn’t answer | 14 | 2.5 |
| Data Carpentry’s U.S. Respondents Racial/Ethnic Identity | n | % |
|---|---|---|
| American Indian or Alaska Native | 4 | 0.7 |
| Asian | 152 | 27.7 |
| Black or African American | 25 | 4.6 |
| Hispanic or Latino(a) | 57 | 10.4 |
| Native Hawaiian or Other Pacific Islander | 3 | 0.5 |
| White | 316 | 57.6 |
| I prefer not to say. | 28 | 5.1 |
| Other | 8 | 1.5 |
| Software Carpentry’s U.S. Respondents’ Gender Identity | n | % |
|---|---|---|
| Female | 3107 | 48.9 |
| Male | 3111 | 49.0 |
| Other | 18 | 0.3 |
| Prefer not to say | 115 | 1.8 |
| Software Carpentry’s U.S. Respondents’ Racial/Ethnic Identity | n | % |
|---|---|---|
| American Indian or Alaskan Native | 29 | 0.5 |
| Asian / Pacific Islander | 1552 | 24.8 |
| Black or African American | 241 | 3.9 |
| Hispanic or Latino | 387 | 6.2 |
| Native Hawaiian or Other Pacific Islander | 5 | 0.1 |
| White / Caucasian | 3447 | 55.1 |
| Multiple ethnicity / Other (please specify) | 221 | 3.5 |
| Prefer not to say | 374 | 6.0 |
Gender and racial/ethnic identity information is collected for U.S. participants, as we are keen to increase the number of diverse instructors and learners we serve. Understanding our demographic makeup helps us to understand what communities we reach and what programs we should develop.
Currently, both Data (56.6%) Carpentry and Software (48.9%) Carpentry see strong representation from women in the United States. Where we hope to improve is in reaching the non-White audience, as fewer than 50.5% for Data Carpentry, and 45% for SWC of our respondents are from communities historically underrepresented in the science, technology, engineering, and mathematics (STEM) fields.
Summary
This report focused on Data and Software Carpentry learners’ skills, perspectives, and experiences in workshops. Our two-day coding workshops increase researchers’ daily programming usage, and confidence in working with open source tools. Currently, Data Carpentry and Software Carpentry use different surveys to collect pre and post workshop data. In the coming months, we plan to develop one common survey to be used for both Data Carpentry and Software Carpentry.
For a comprehensive look at our workshops and instructor training, have a look at our programmatic assessment report.